Get in Sync With The Markets
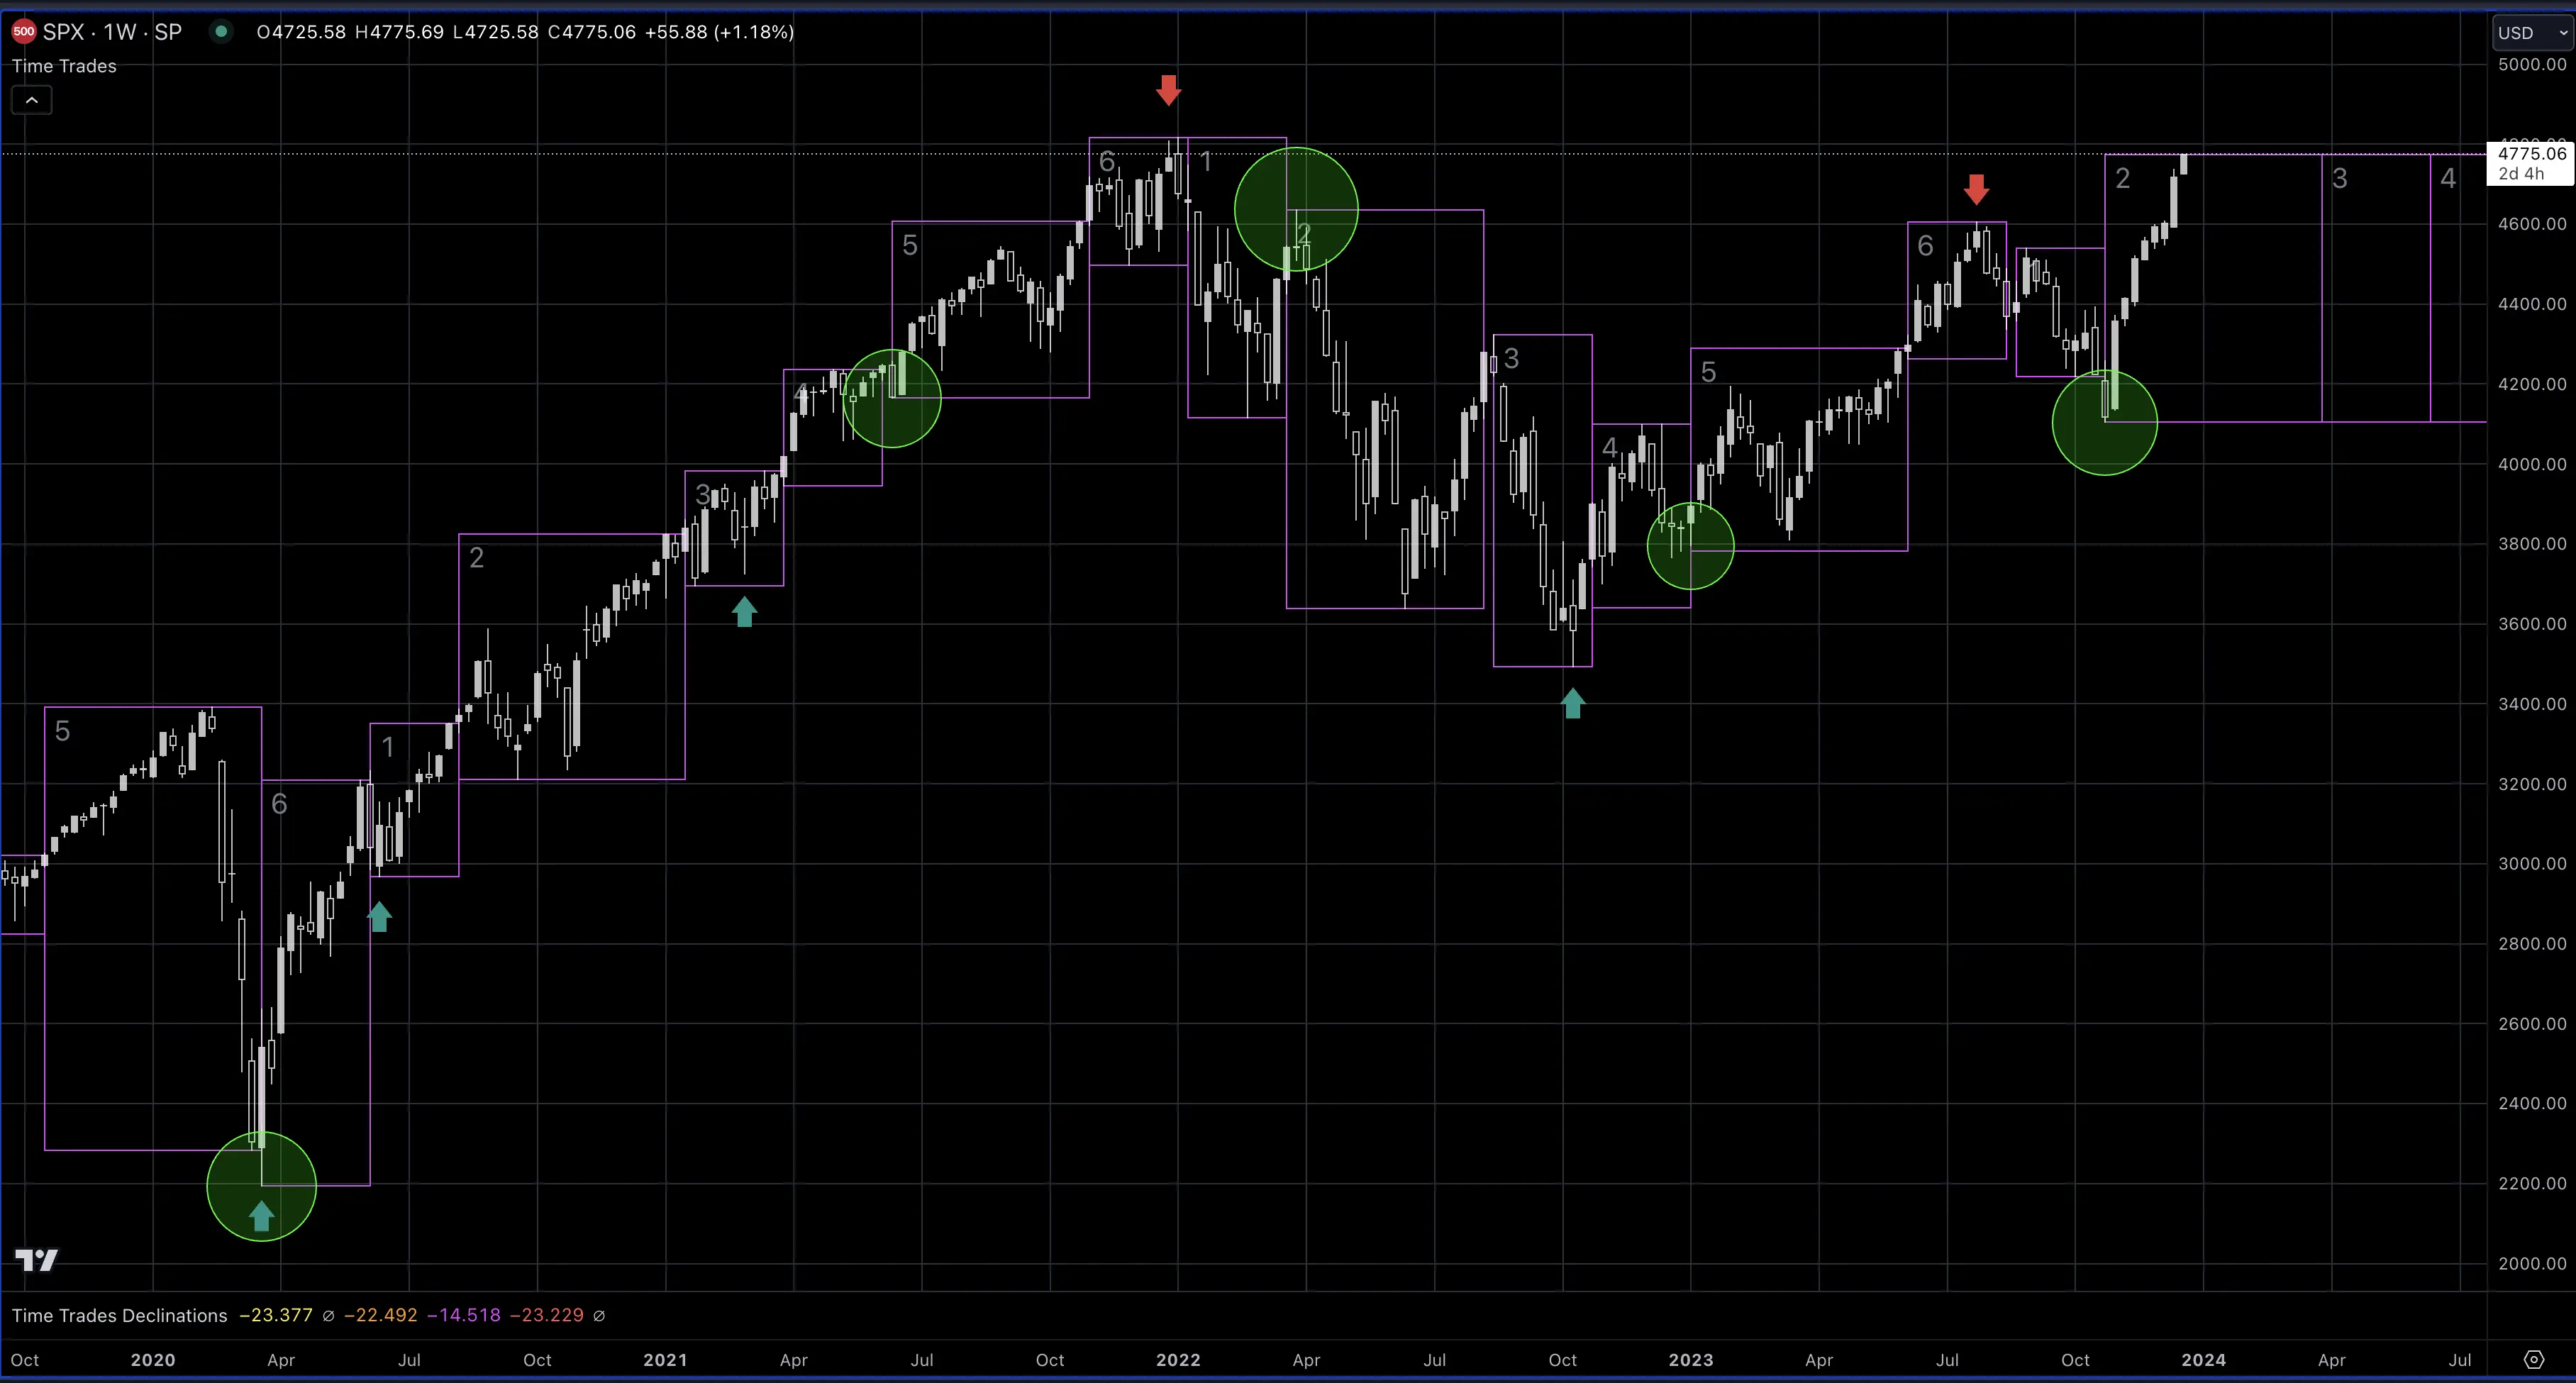
Identify times when prices are likely to trend, and times when prices are likely to consolidate and pivot.
Intervals 2 and 5 are typically large, strong trends, while intervals 1, 3, 4, and 6 tend to be choppier and more likely to reverse.
The transitions at the start and end an interval 2 or 5 often results in a major pivot.
Dynamically switch your strategy from a trend following strategy to a reversal strategy.
Find Hidden Levels
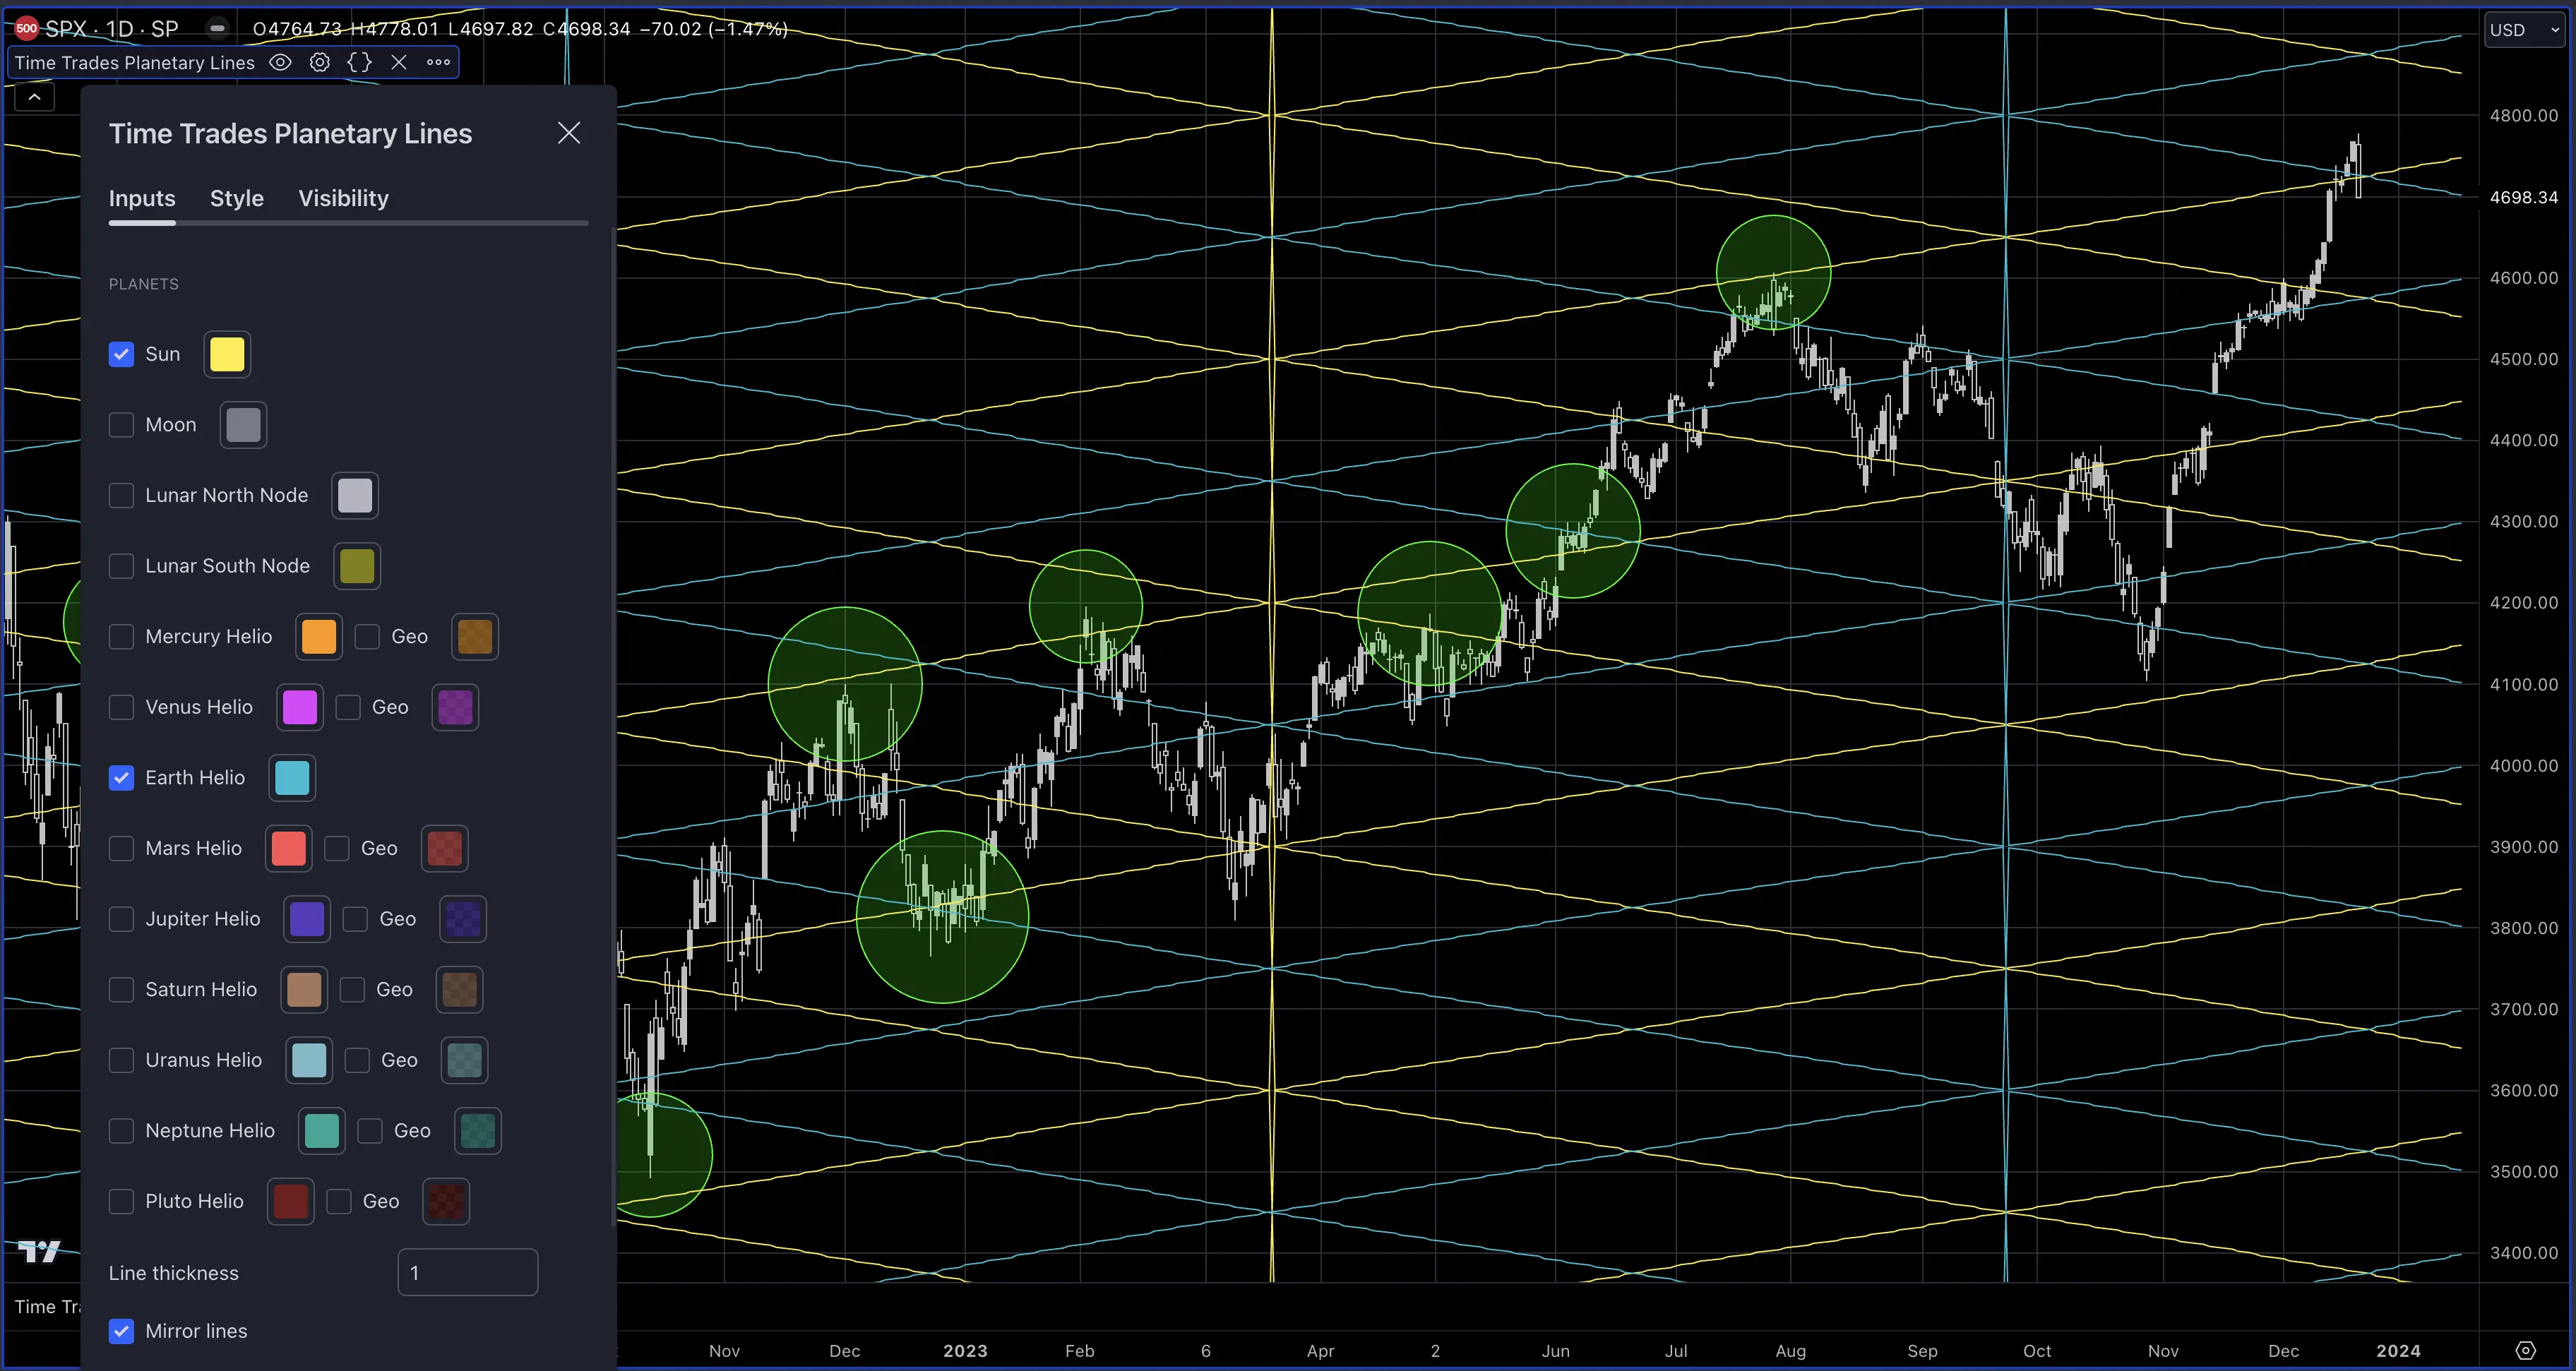
Uncover hidden support and resistance levels by converting planet locations to price.
Supports the Sun, Moon, and all planets both geocentric and heliocentric. Also includes the lunar nodes.
You can see how the Sun and Earth lines provide reliable support and resistance levels.
Identify Cycles
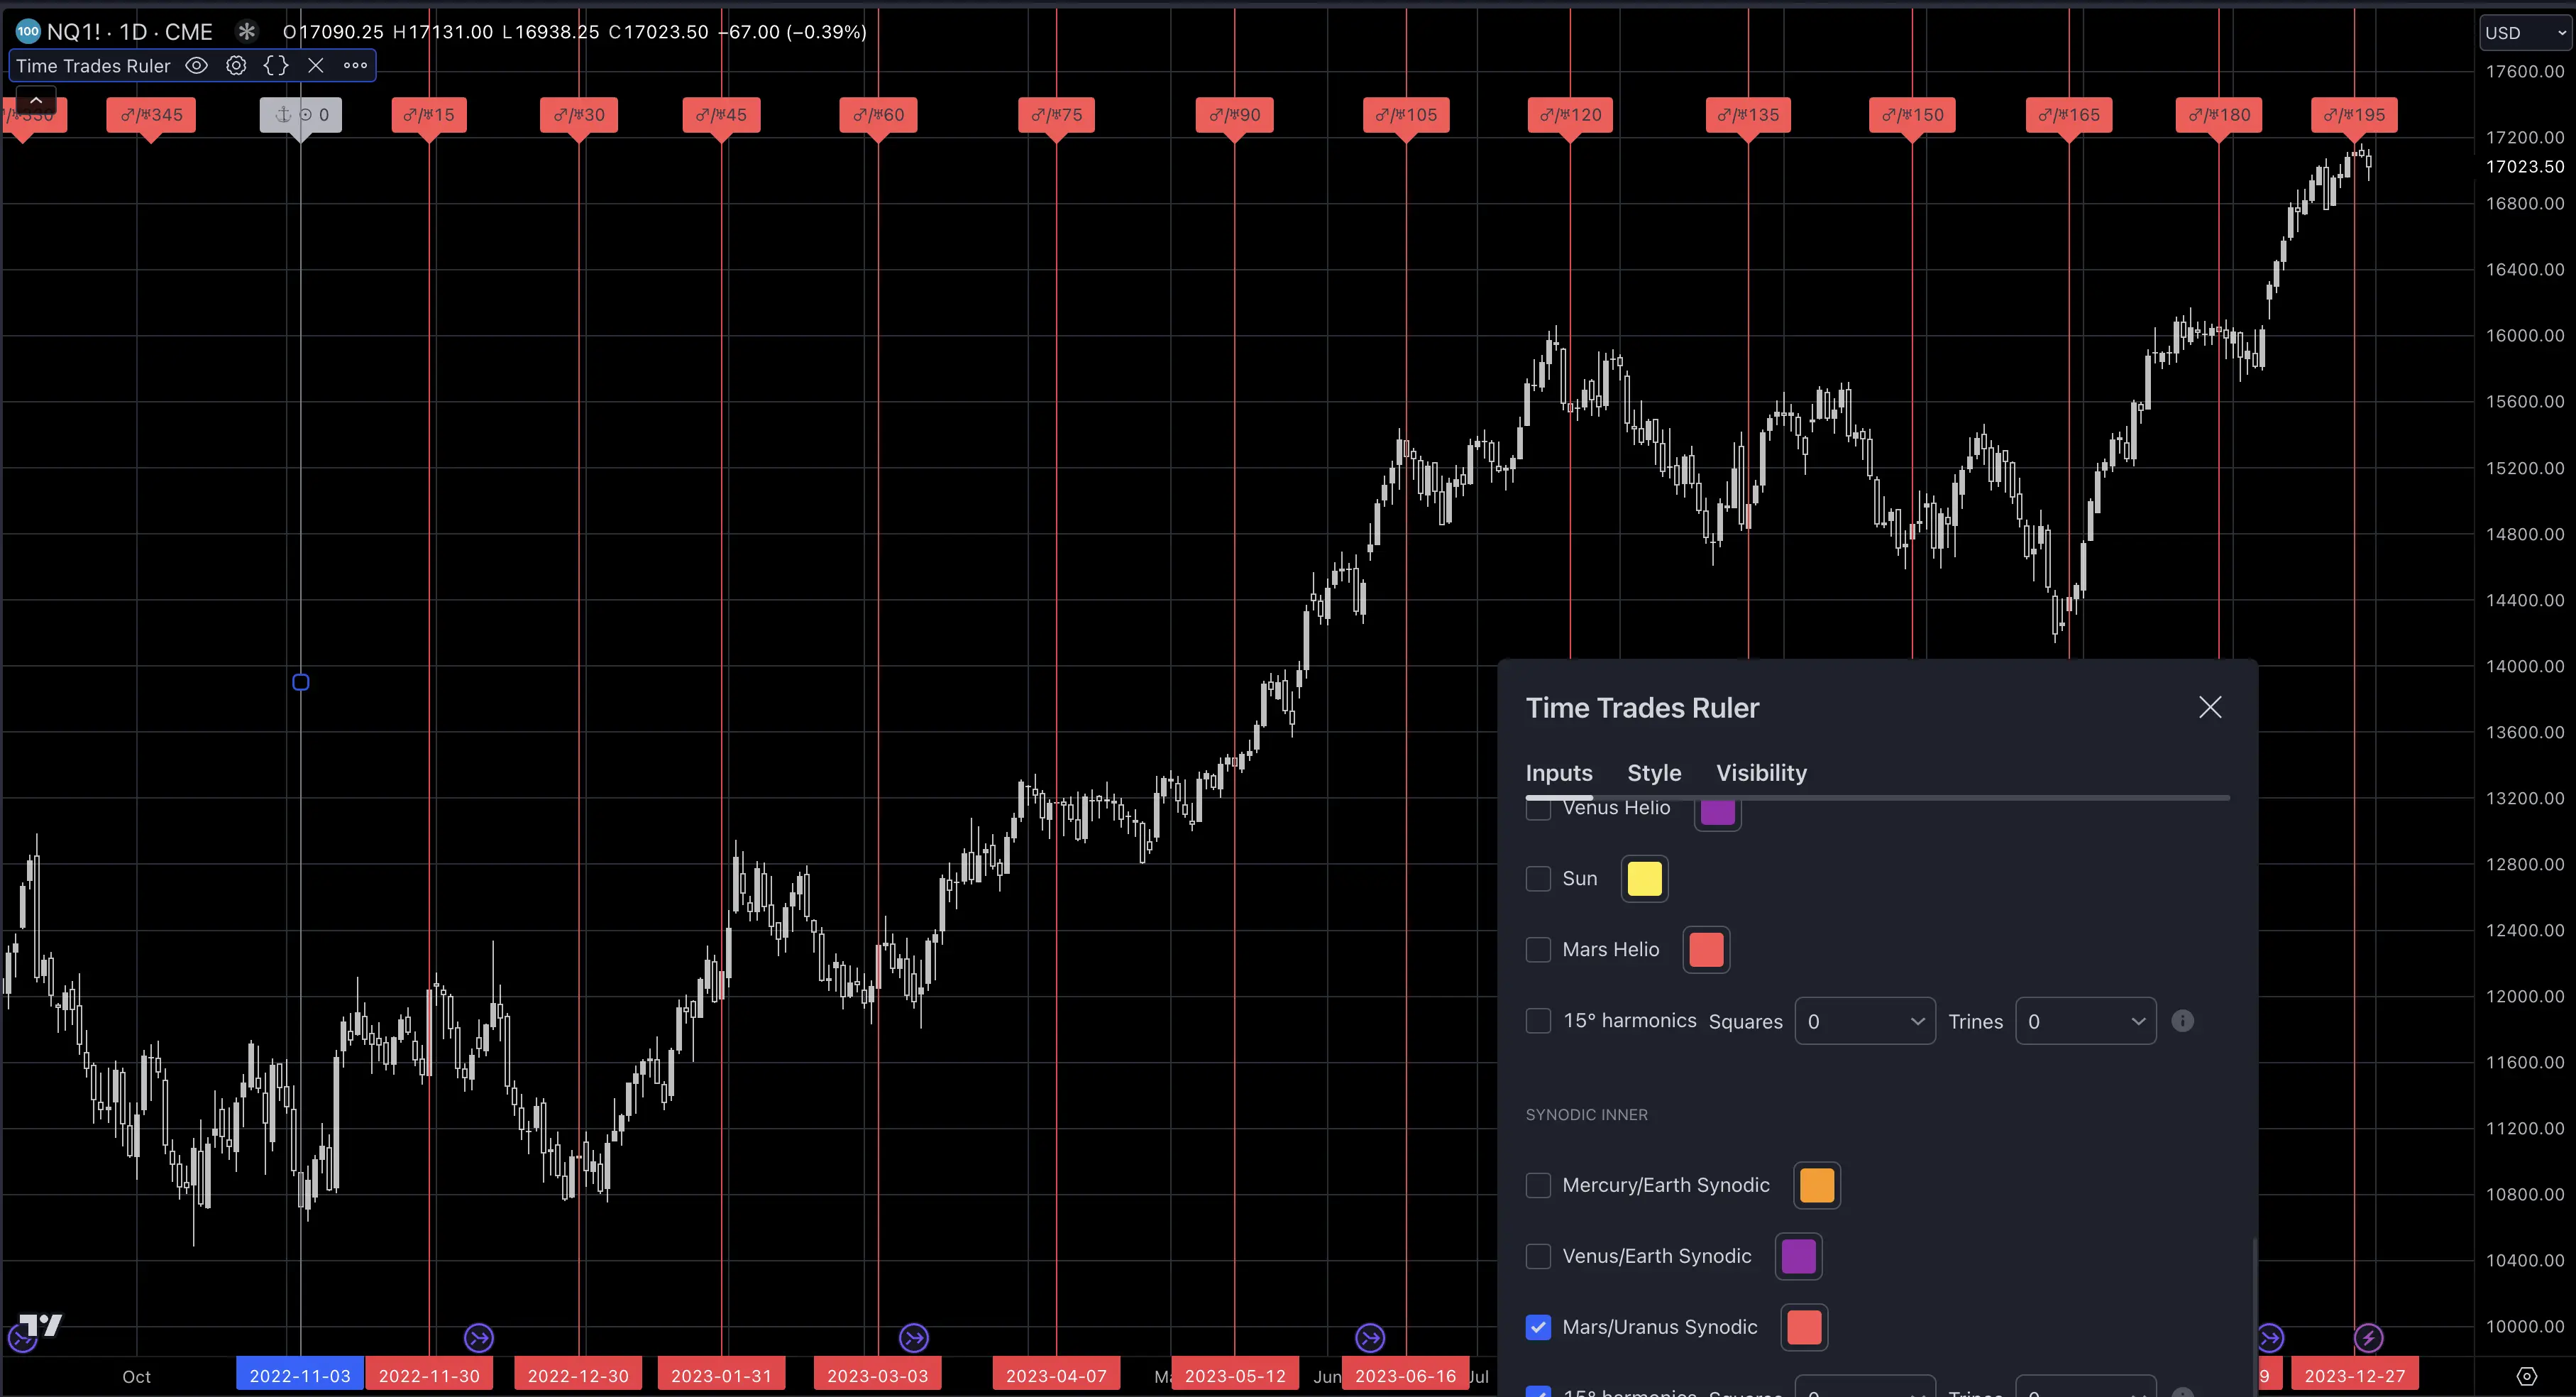
Choose from among 12 possible cycles to see which are active in the asset you're trading.
Know When Markets Could Pivot
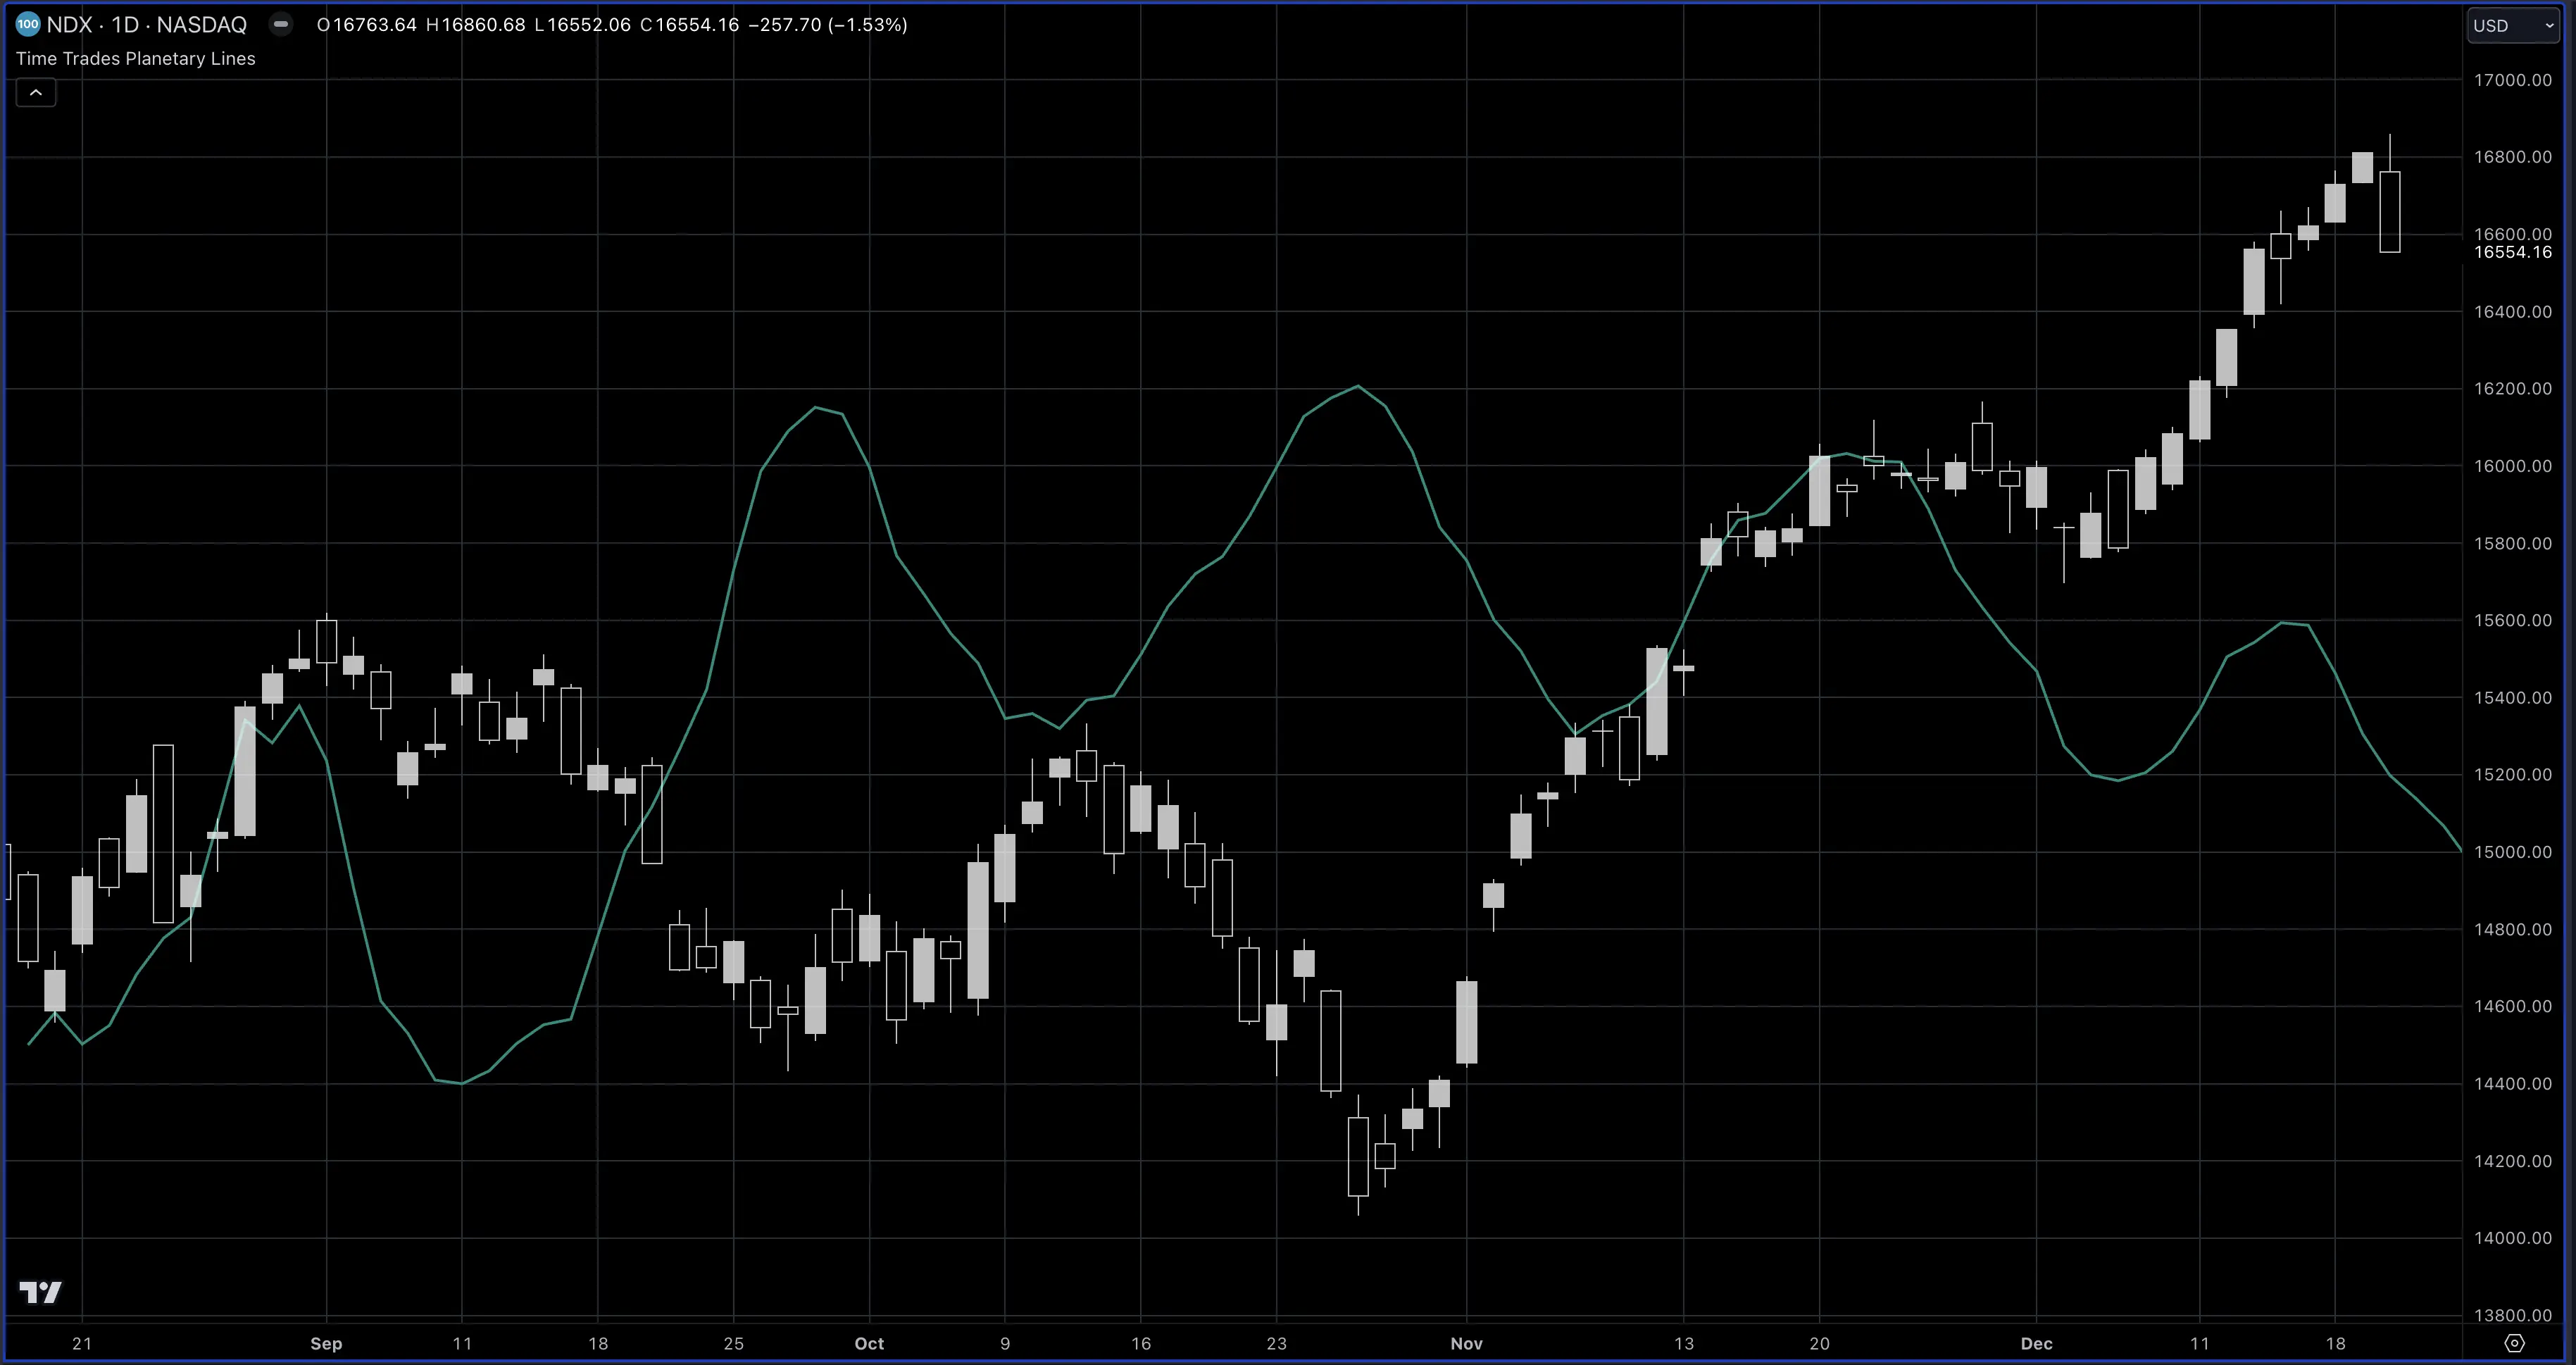
The speed index indicator shows speed fluctuations of planets in the solar system.
See for yourself how pivots in the speed index align with pivots in price.
The speed index is an option of the Planetary Lines script.
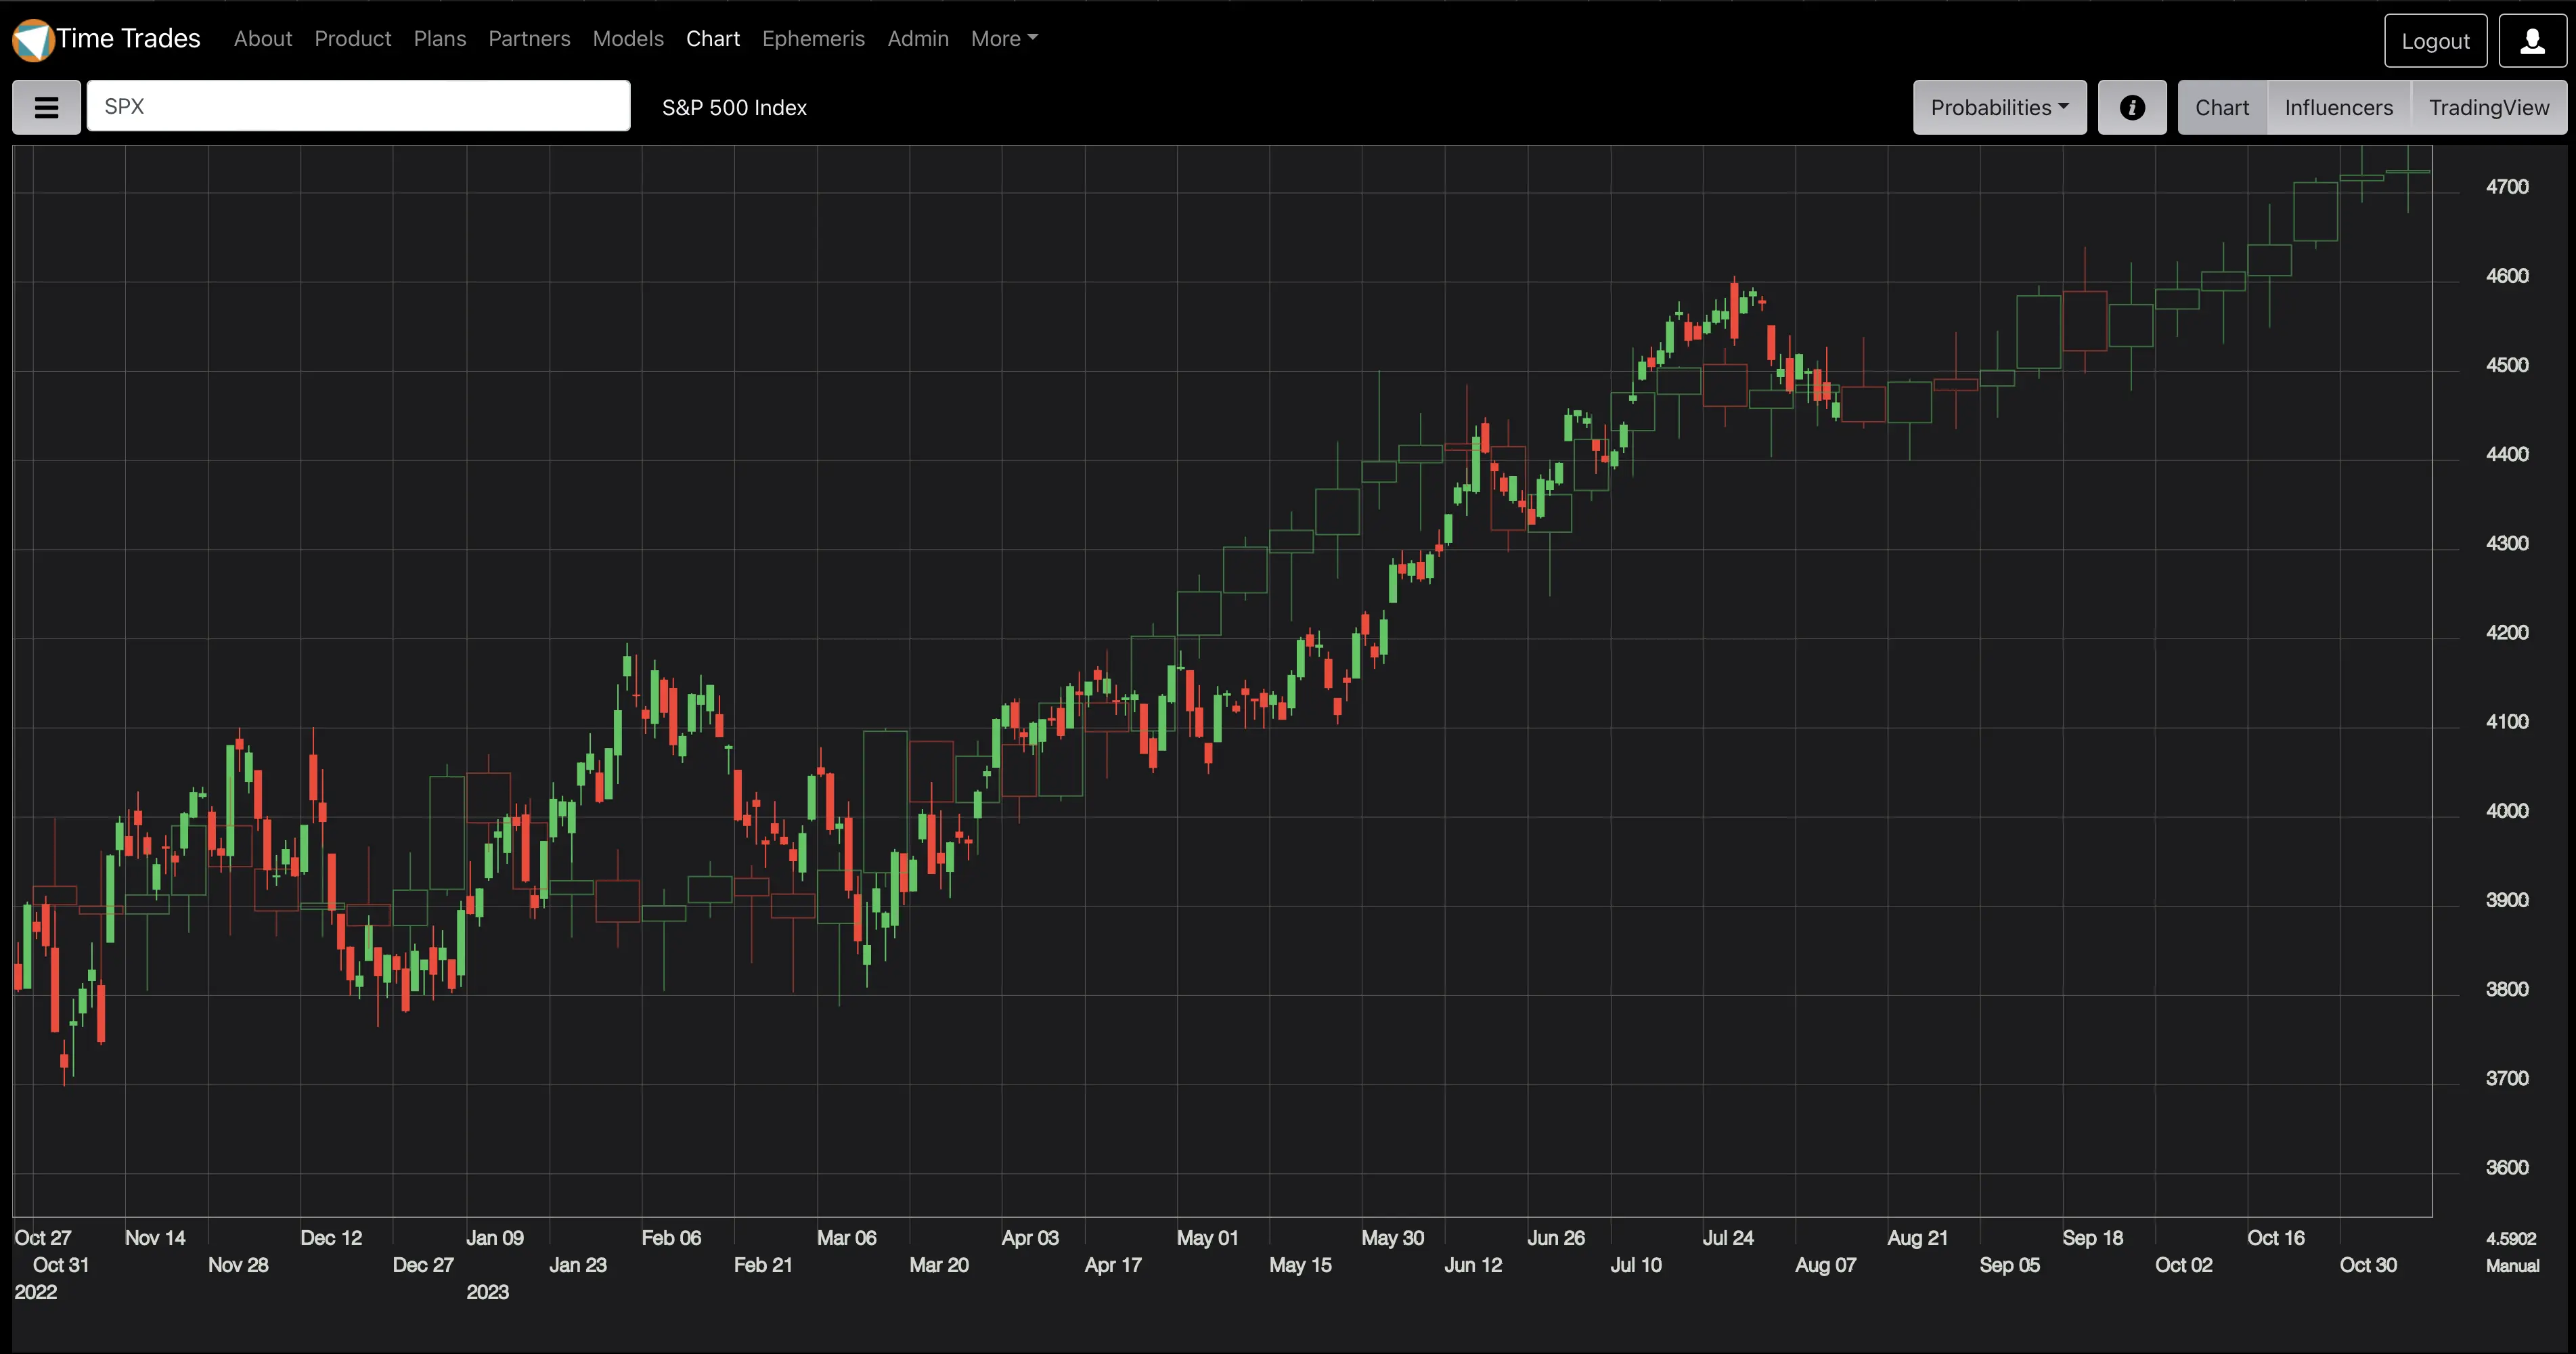
Visualize a Roadmap of Price
See a composite of prices from 10, 20, and 60 years prior, displayed as a weekly candle. WD Gann used a technique similar to this for his annual forecasts.
- Includes full candle data - open, high low and close.
- 52 weeks of future candles for yearly subscribers.
- 6 weeks of future candles for monthly subscribers.
- Overlaid on past price so you can review the correlation.
- Unlike a PDF, you can clearly see the date and trend implied by the candles as you move your mouse.
- Available for SPX and DJI.
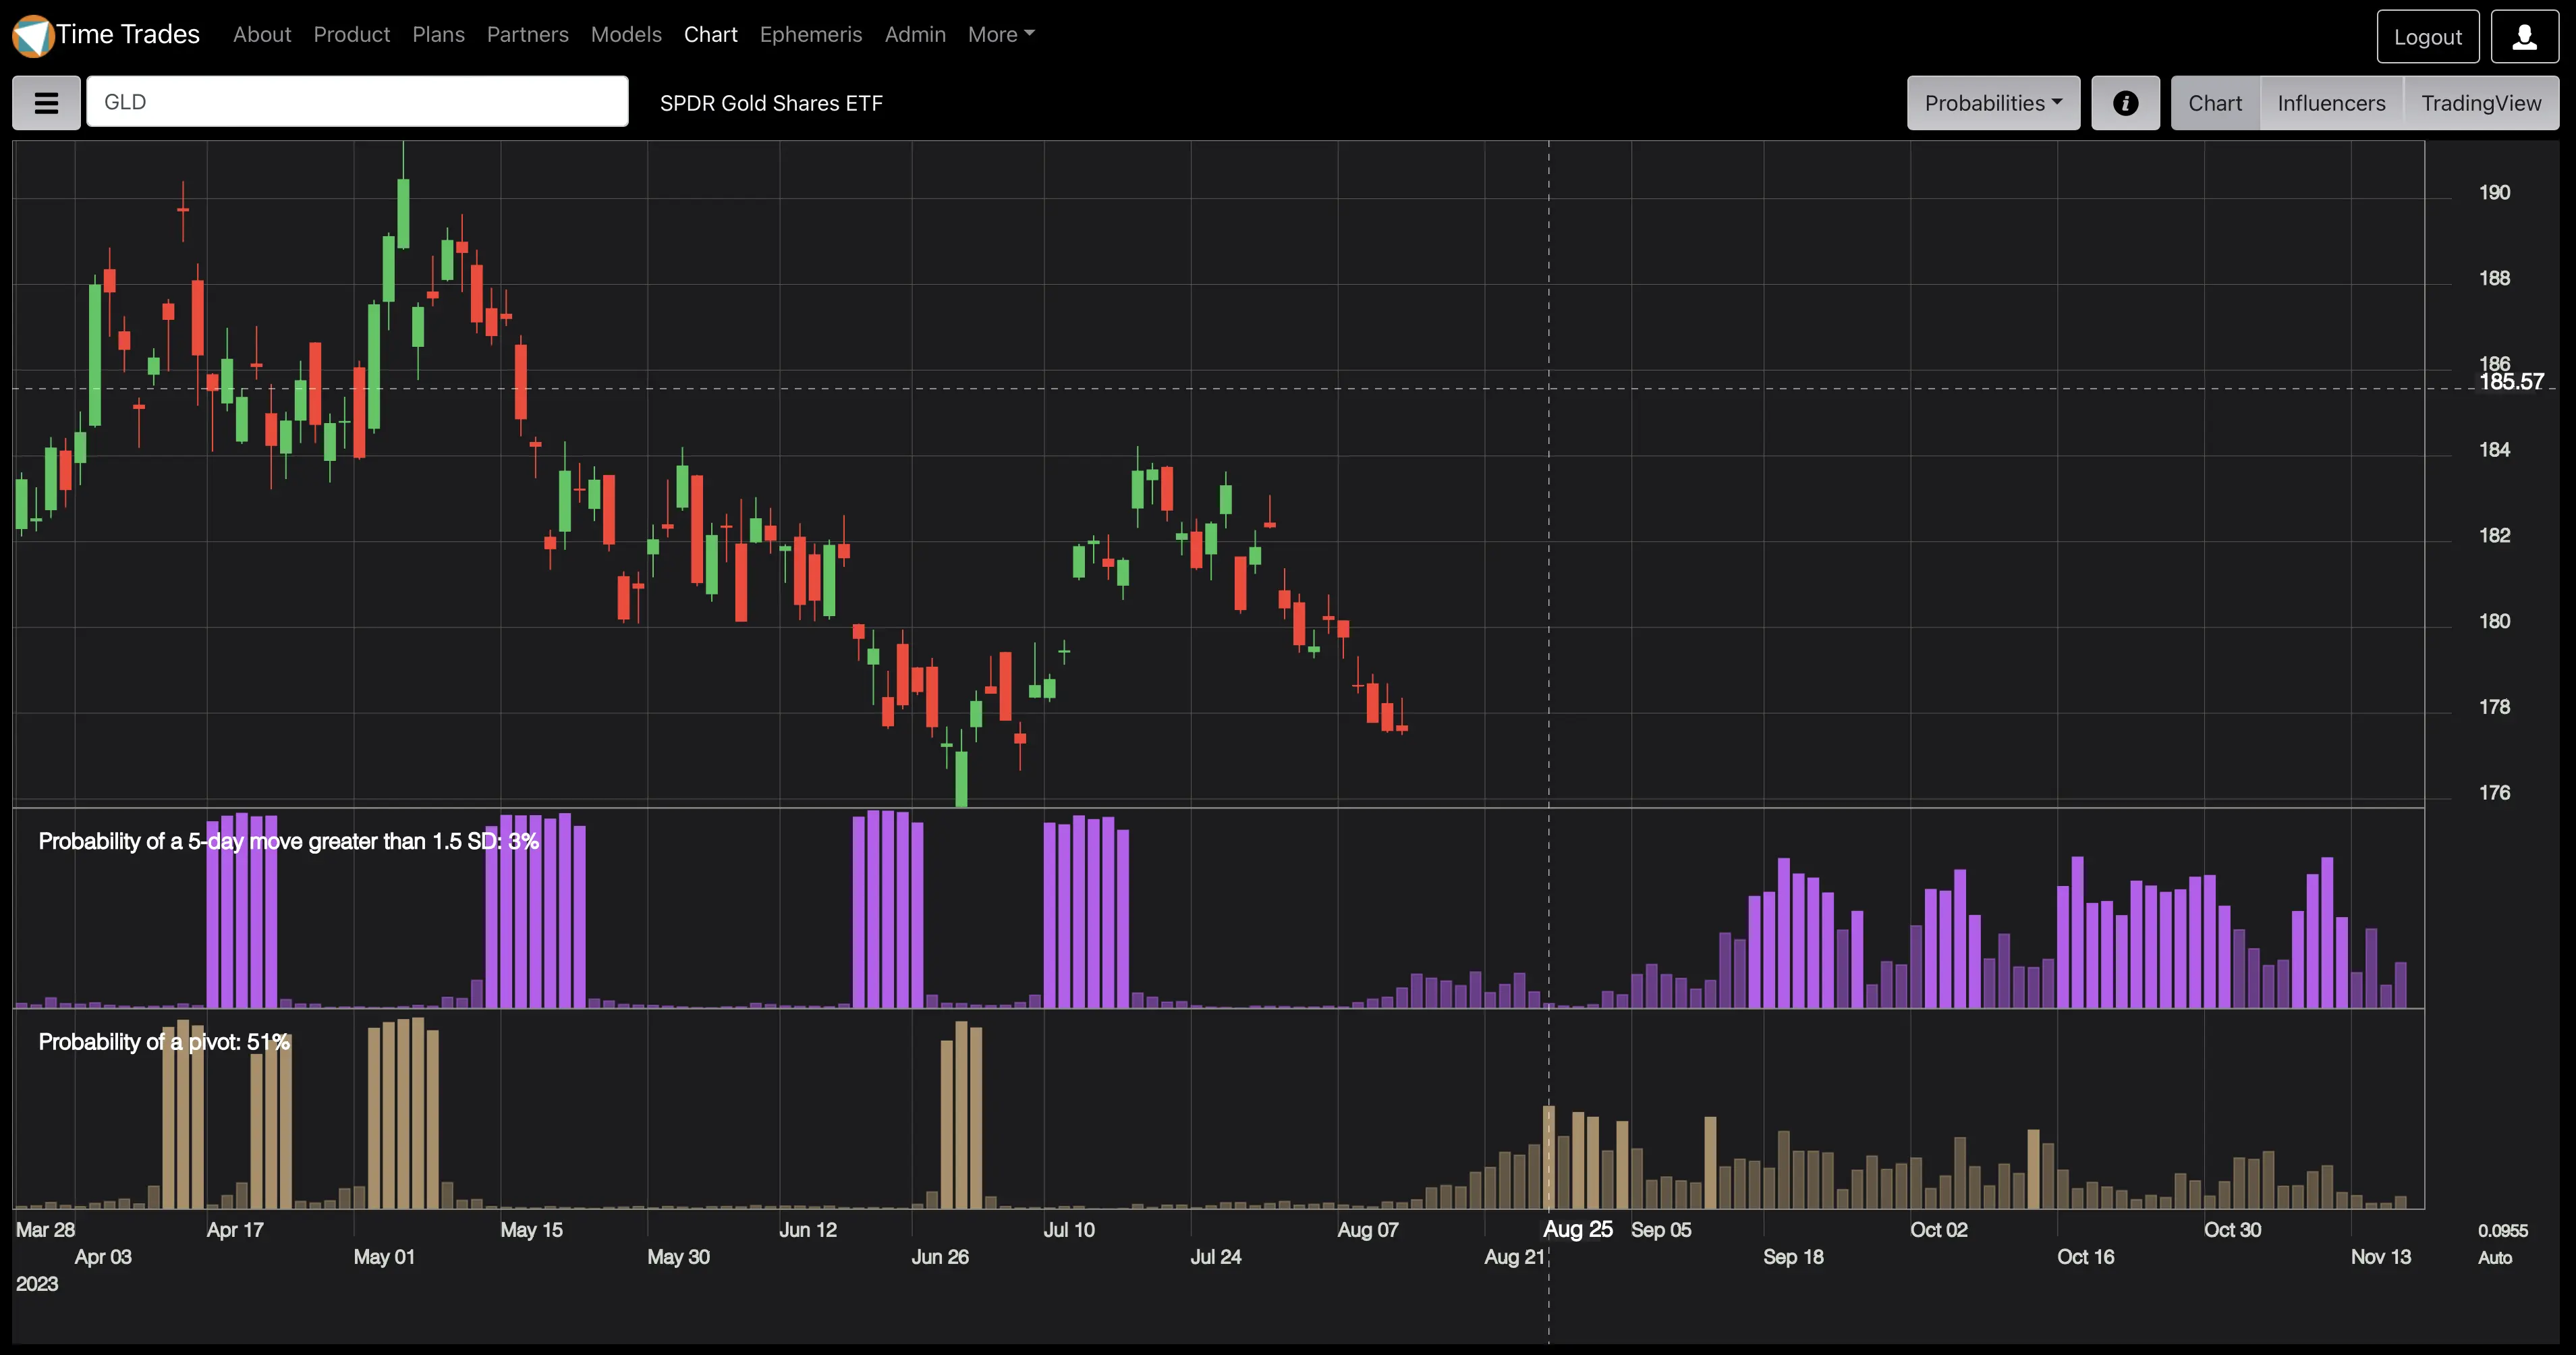
View AI Forecasts
Time Trades includes Artificial Intelligence (AI) that computes and displays the probability of a pivot and the probability of a move in any direction.
- No directional bias eliminates the risk of inversion.
- Helps pinpoint the optimal times to buy options, and when to write options.
- Let the market elect the direction of the trade.
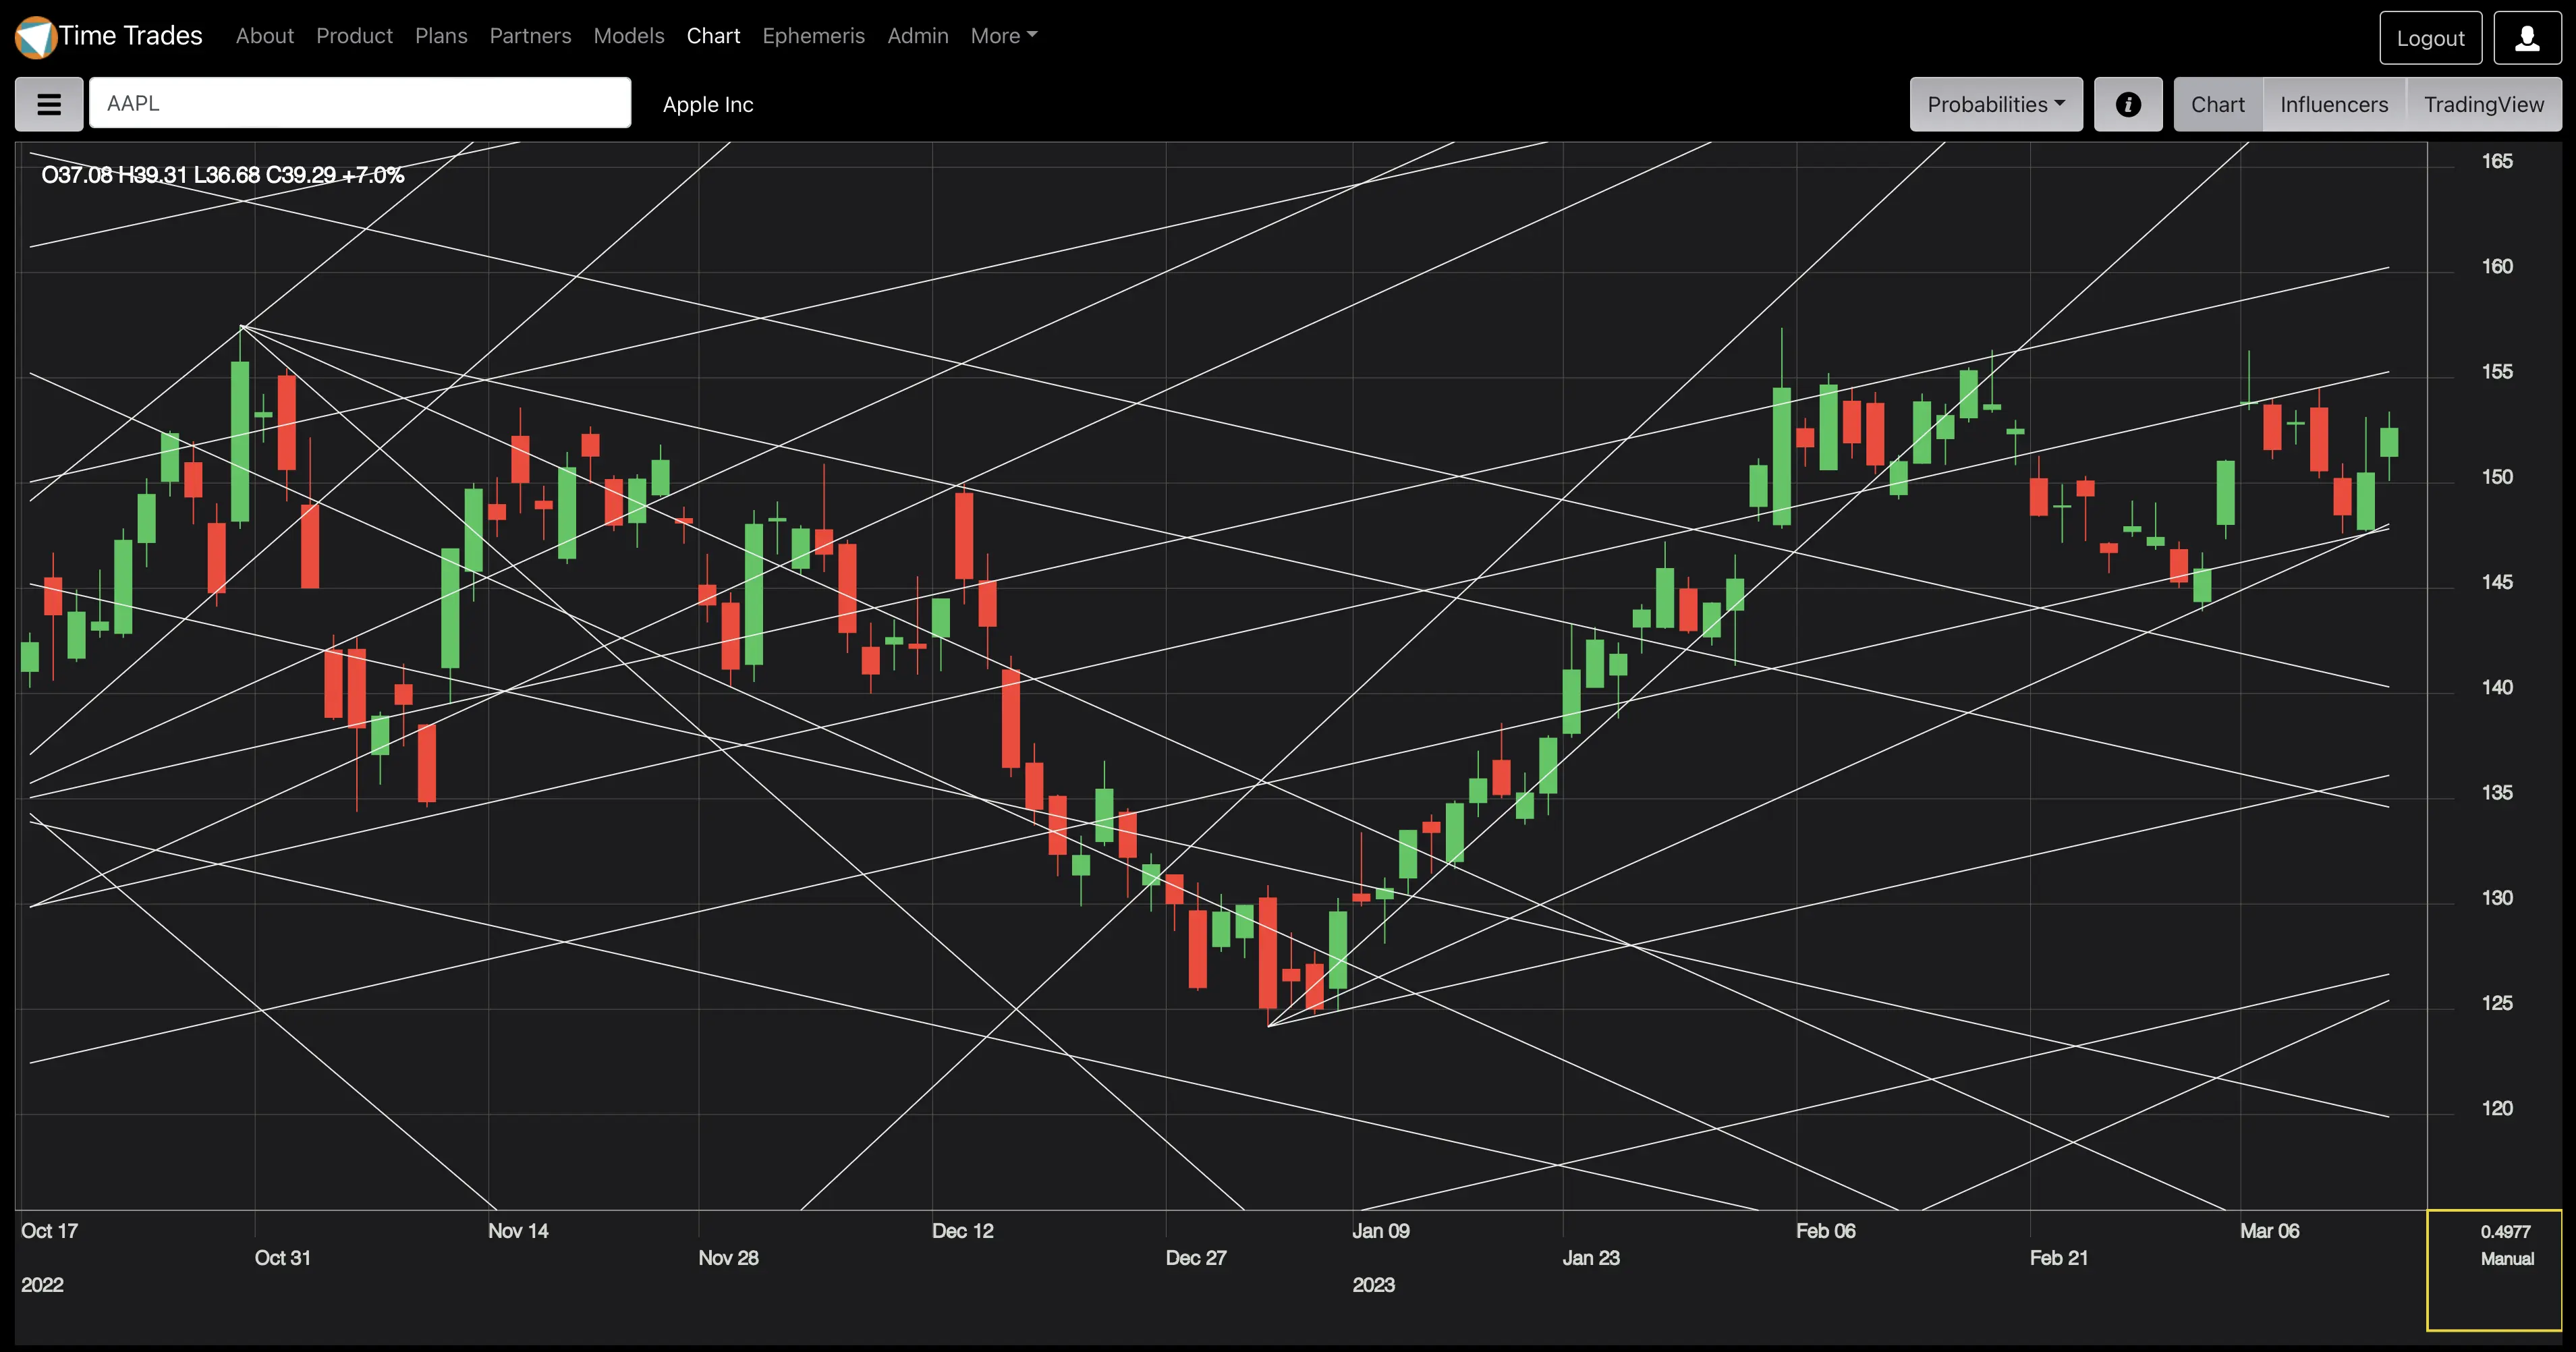
Square a Chart With Ease
If you have worked with Gann techniques before you know the first thing to do is to 'square' the chart.
This means you need to establish the aspect ratio between time and price.
Doing this manually requires drawing many trendlines from pivot points and then making manual adjustments.
Time Trades automatically draws Gann Fans from major pivots, so all you need to do to square the chart is drag the price axis up and down to get the best fit.
The resulting price to bar ratio can be used directly in TradingView for further analysis.
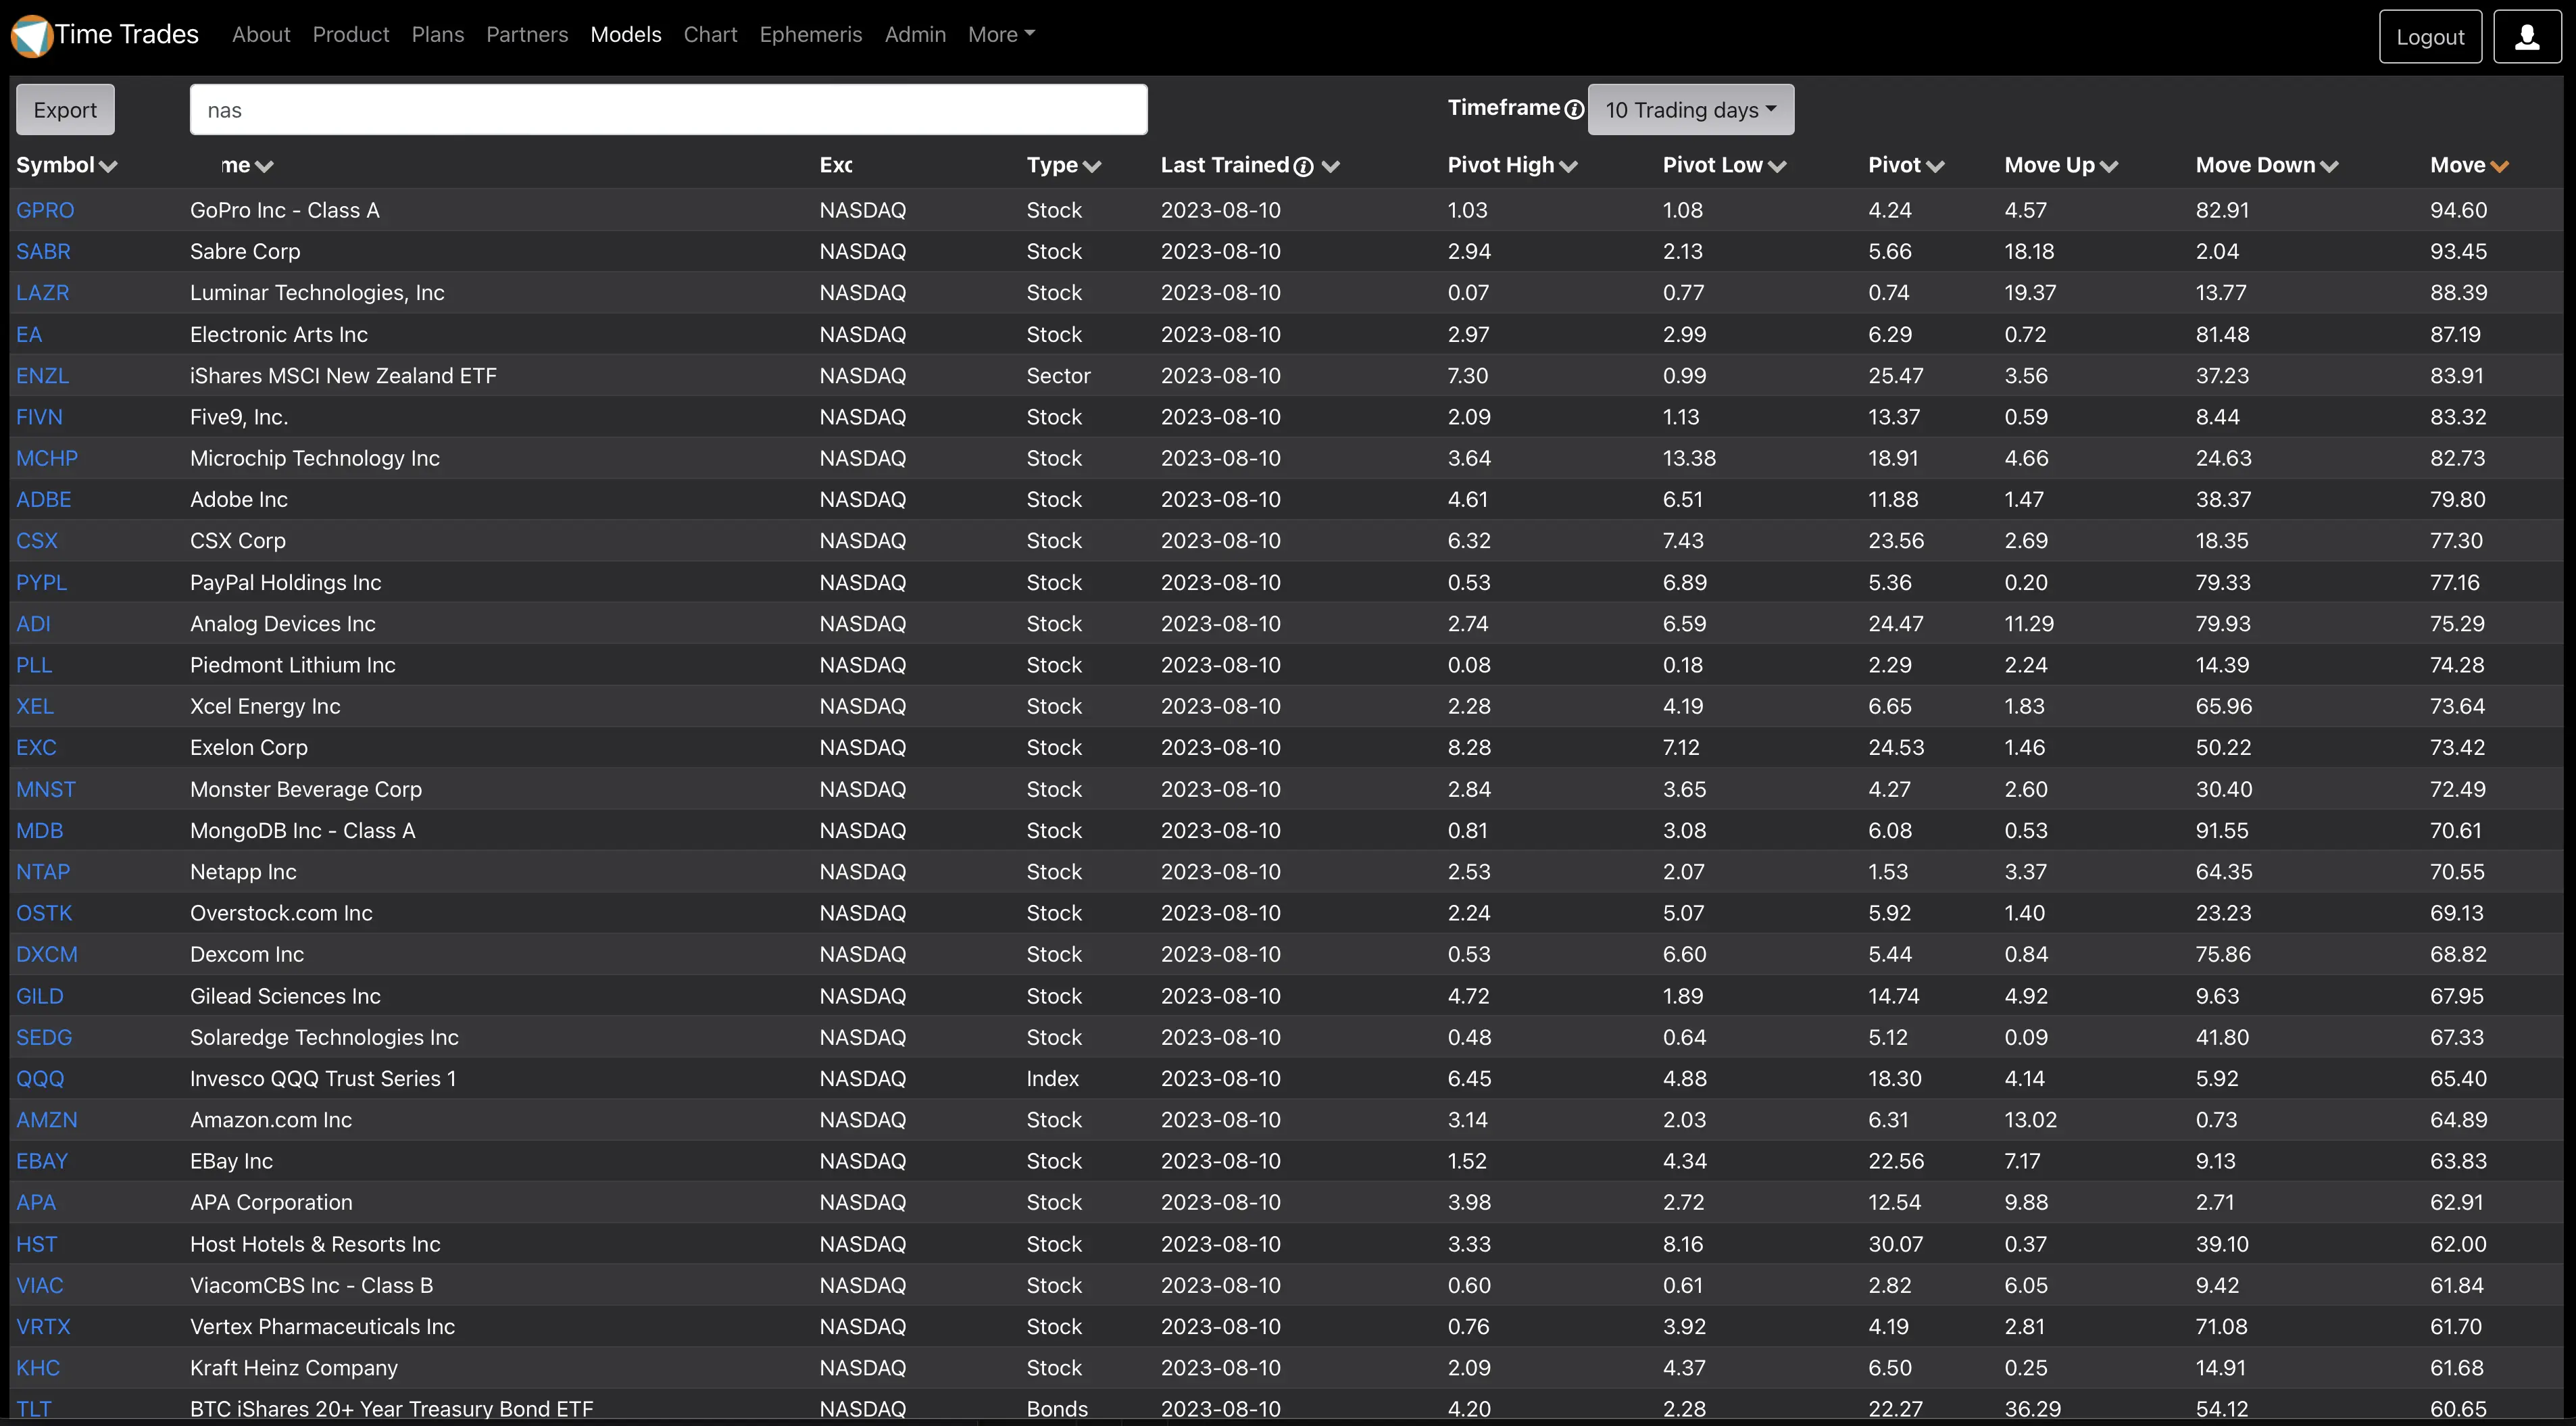
Scan for the Best Opportunities
Quickly find the best trading opportunities among hundreds of stocks and coins.
With over 800 symbols in Time Trades, you don't have to look through them one-by-one to find a high probability trade.
The screenshot shows how the Models tab allows you to find all Nasdaq stocks with the highest probability of a move in the next 10 trading days.
This is ideal as a first pass screener to find the stocks, coins, or currency pairs worth a more detailed analysis.
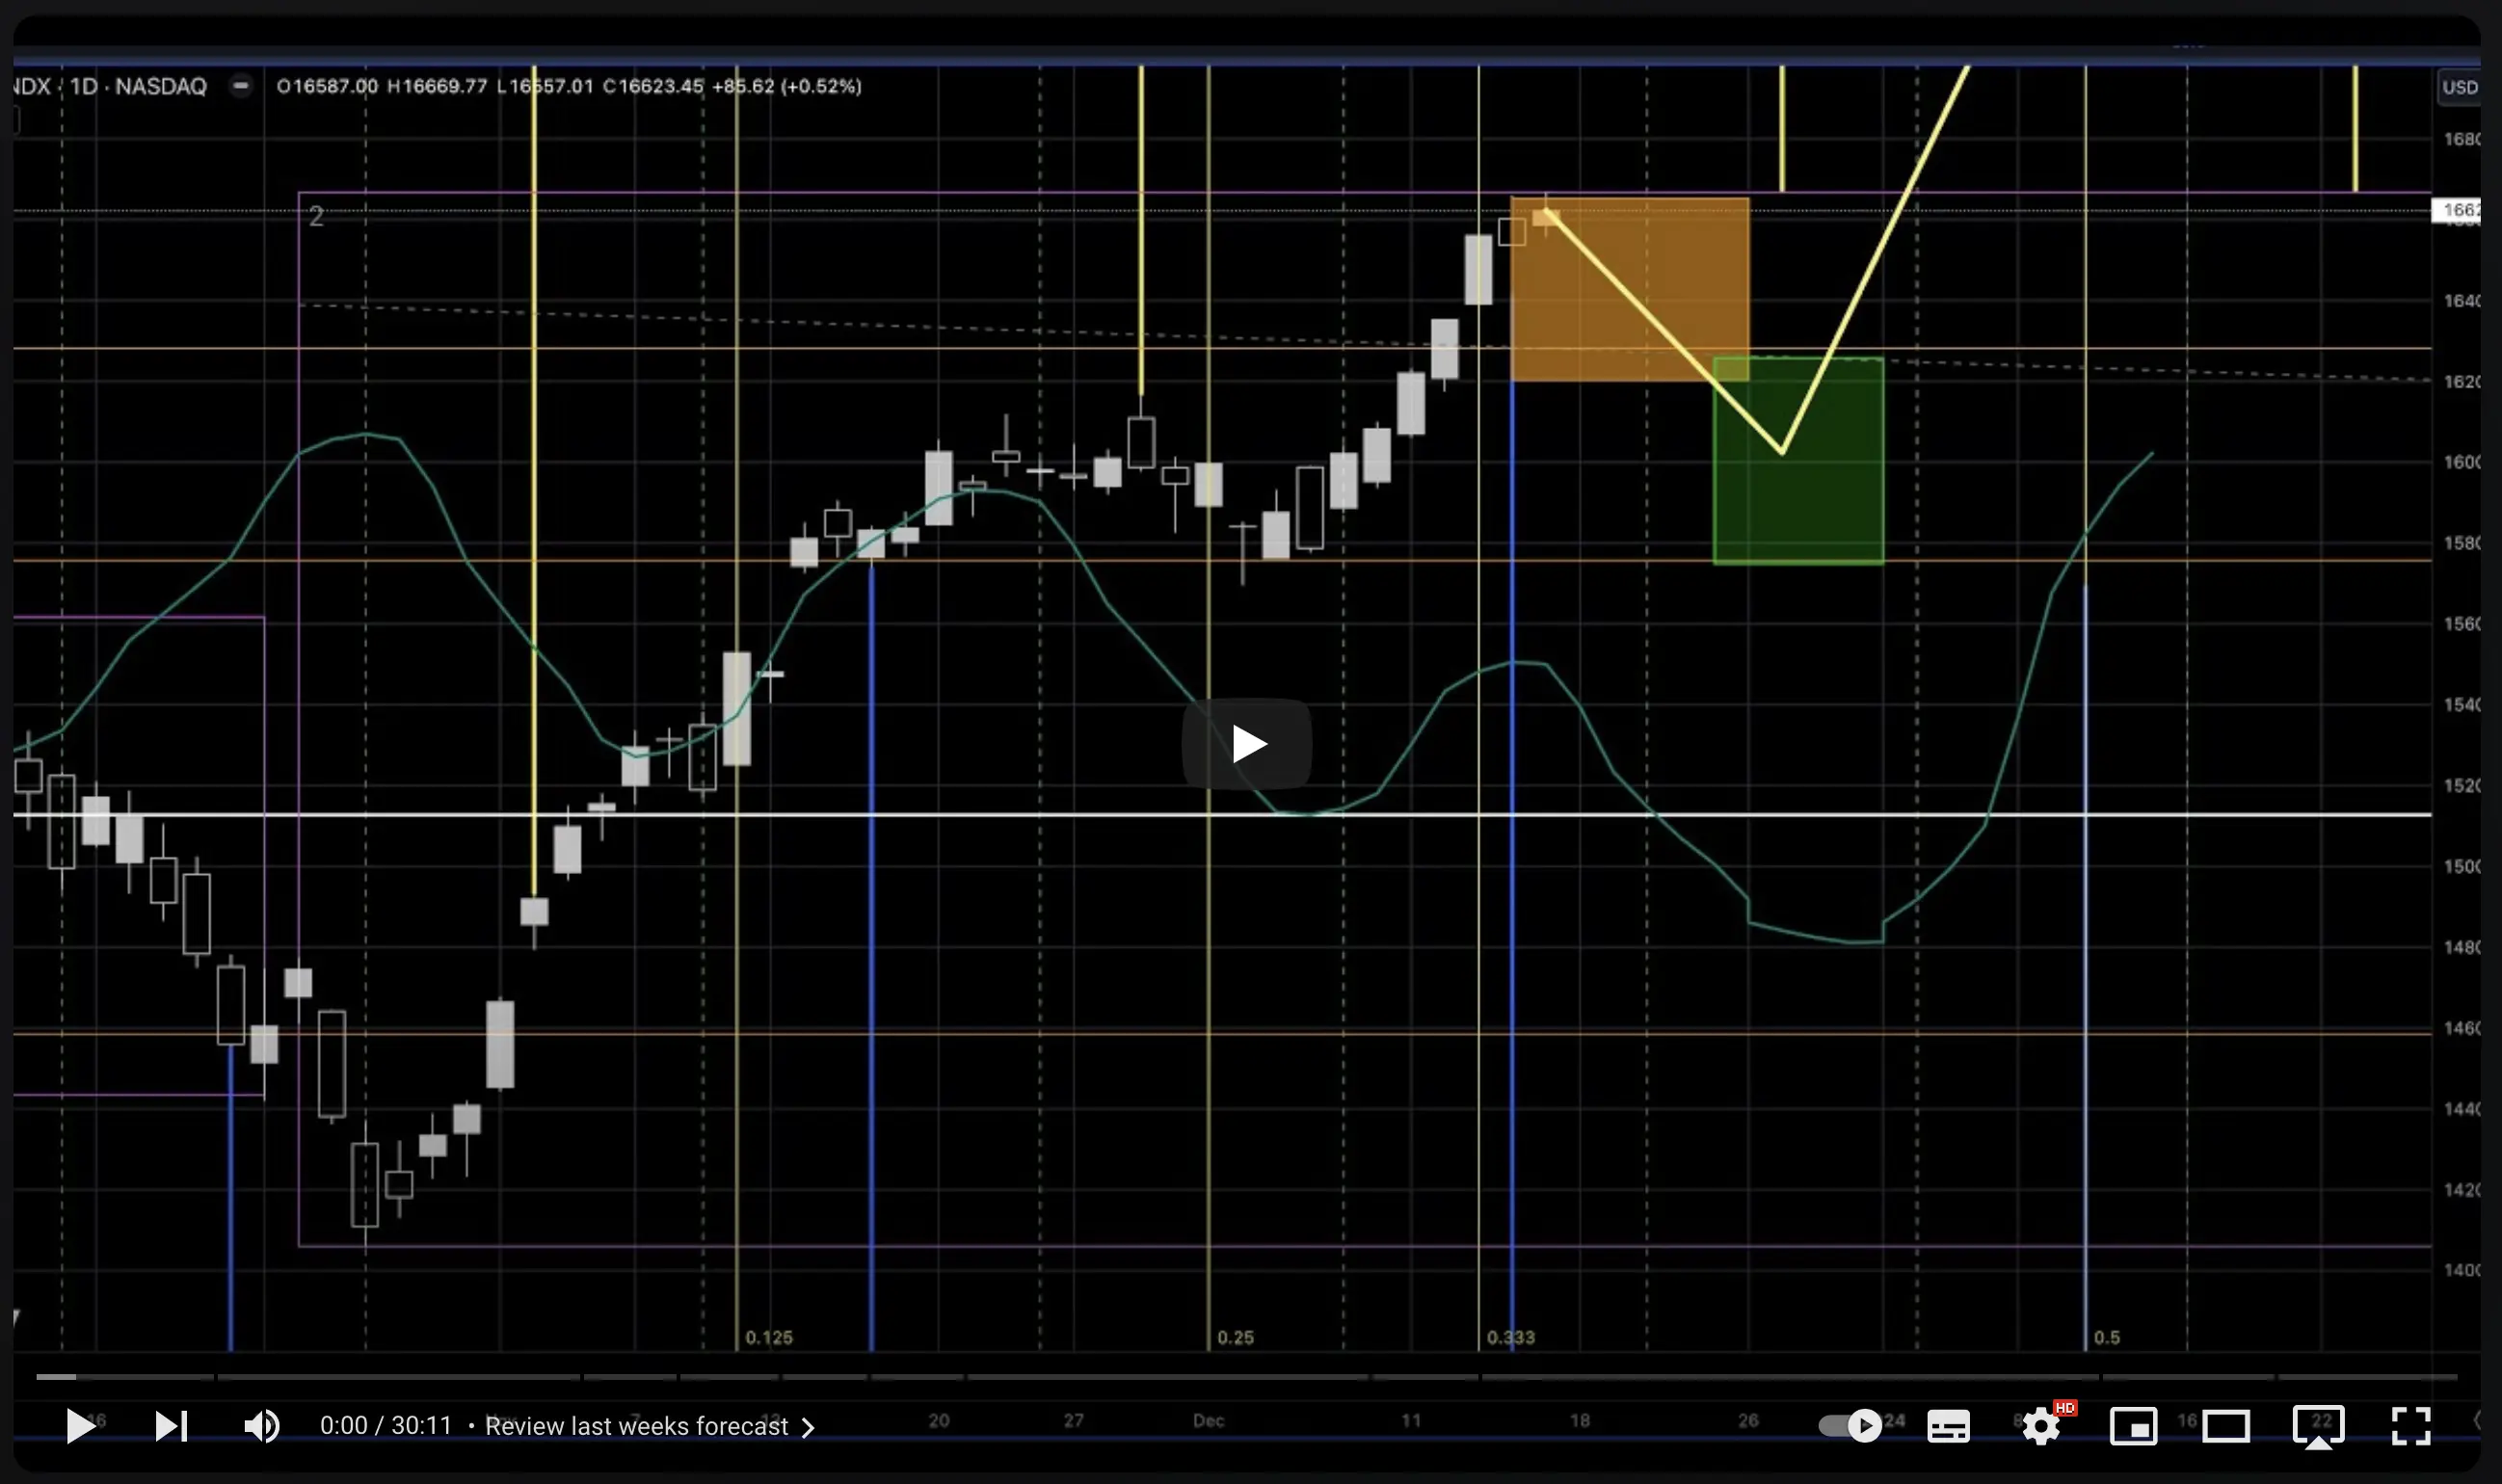
Weekly Analysis Video
Every week I record a 20-30 minute video reviewing stock indices, the dollar, crypto and gold.
I use the Time Trades tools and sometimes my own personal research to update forecasts and review the success of past forecasts.
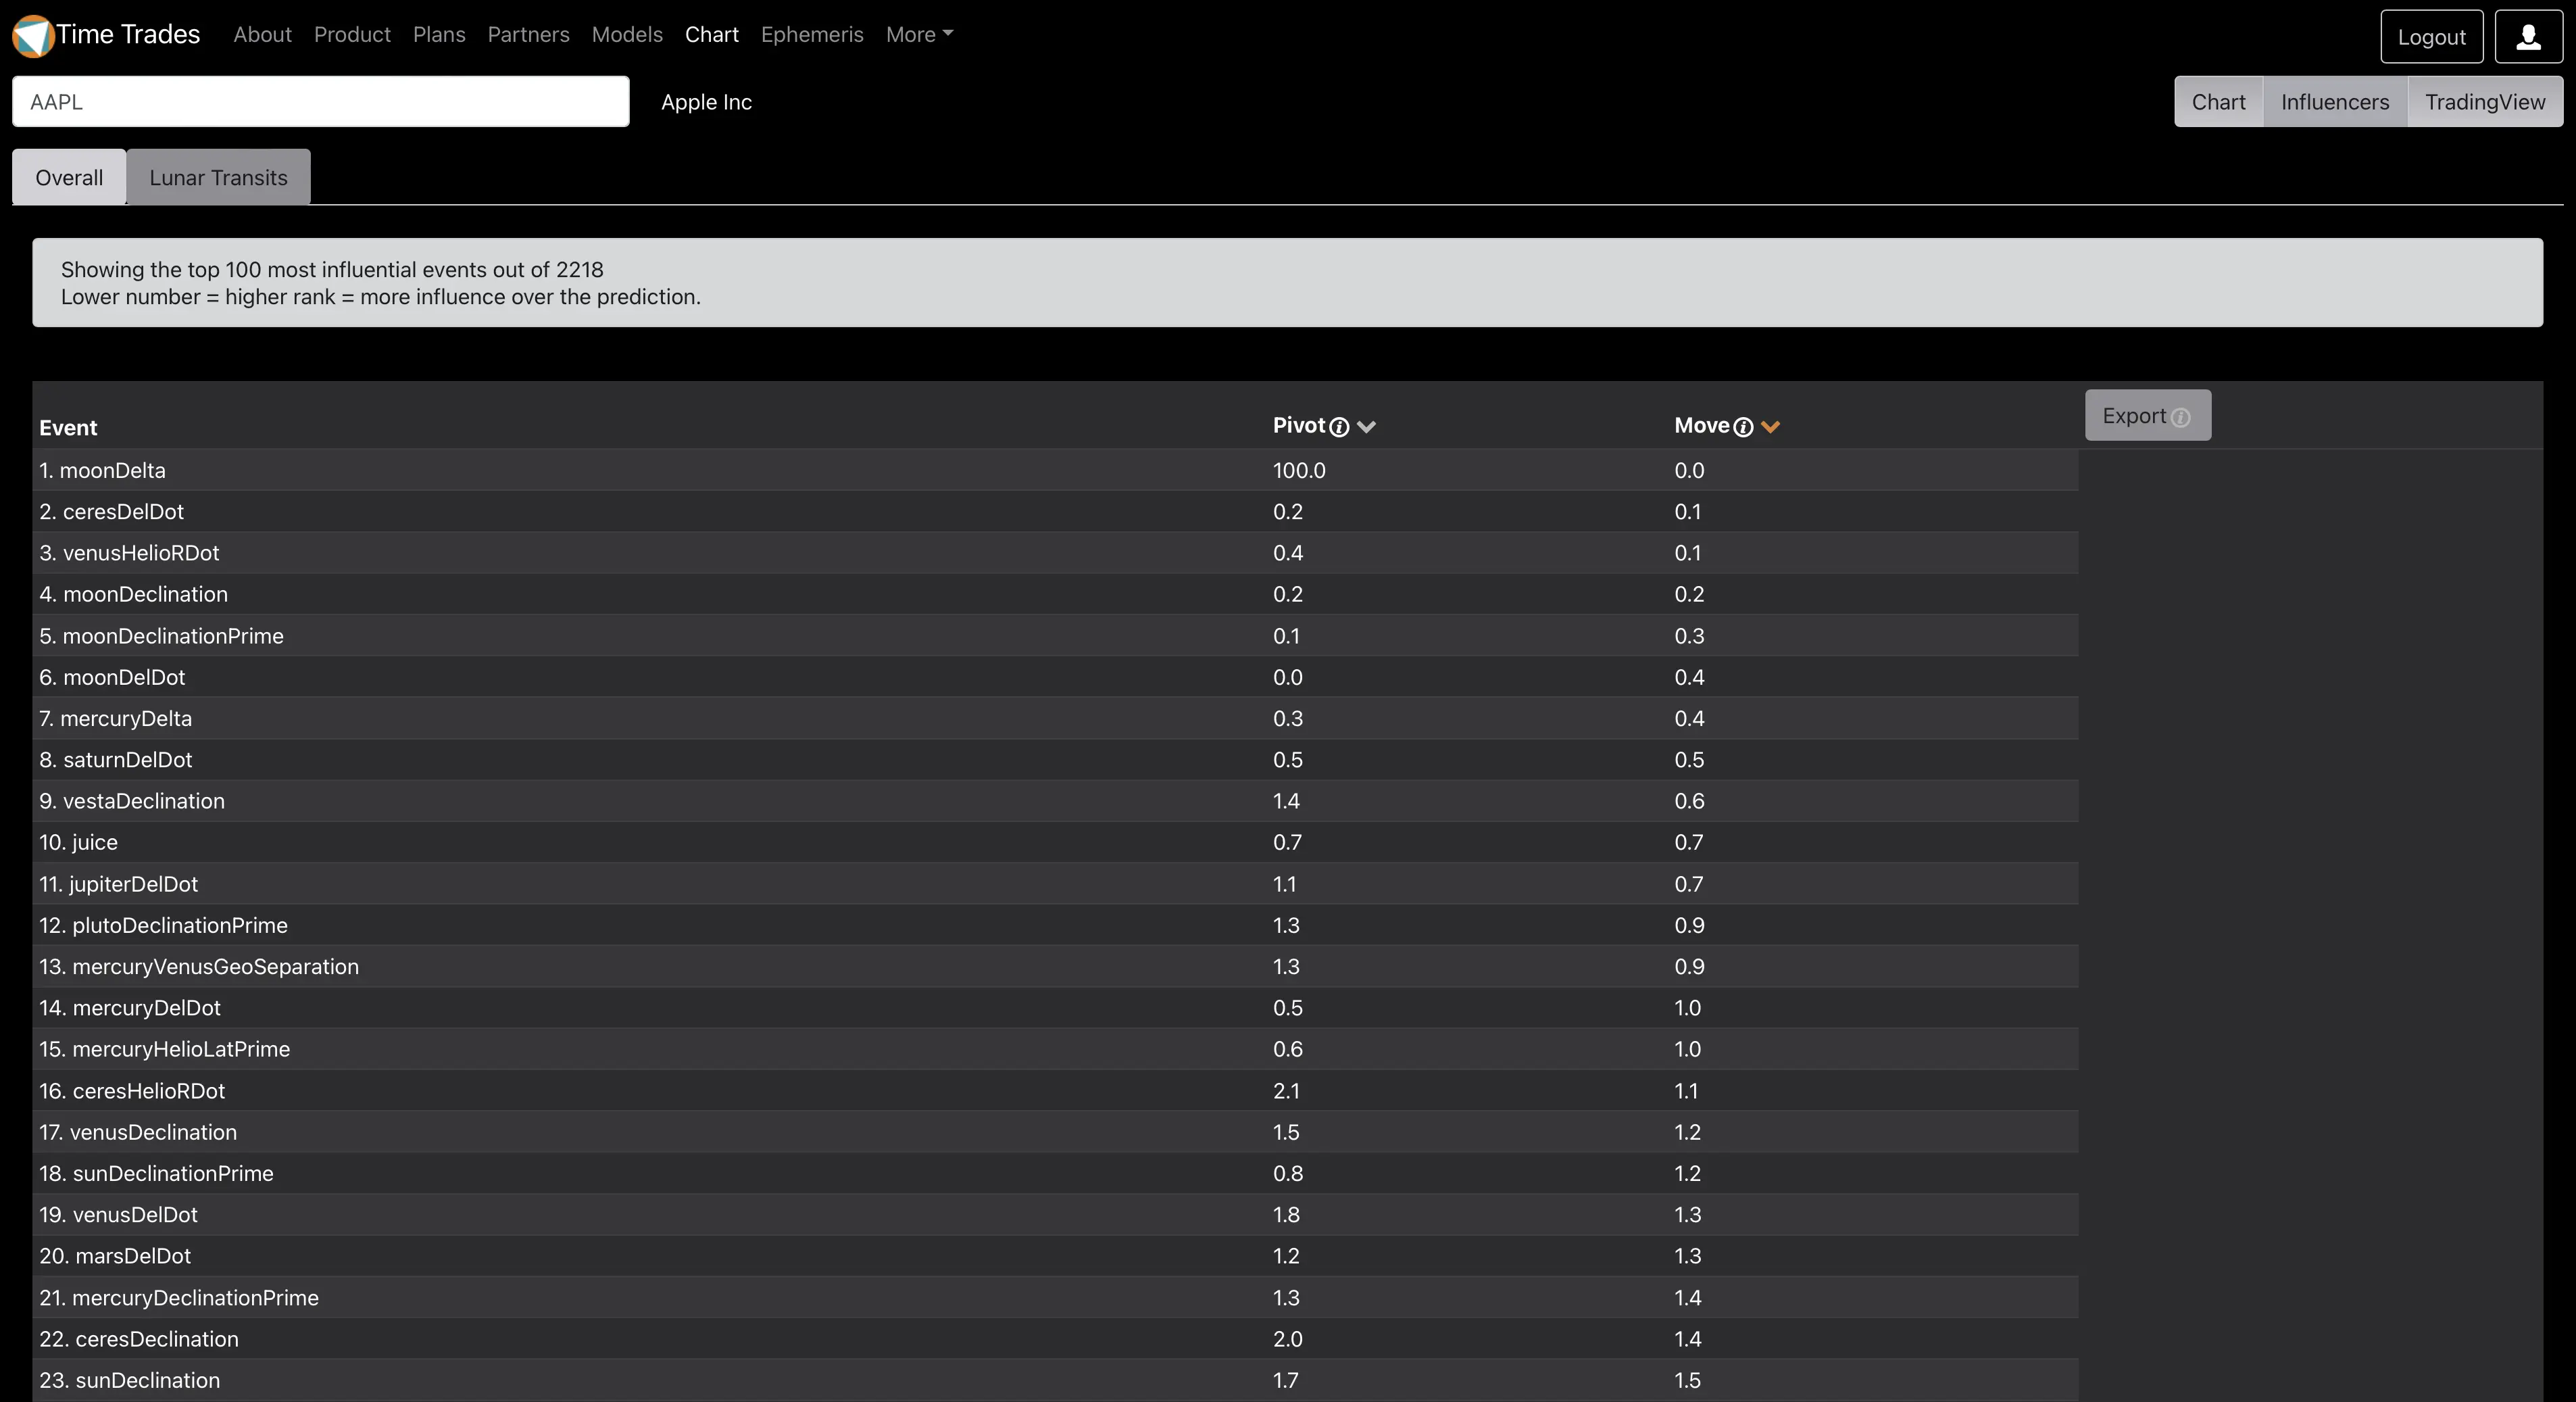
Identify Key Influencers
Time Trades isn't a black box. It exposes what it learns so you can see the most influential timing events.
This screen shot shows that distance to the Moon (moonDelta) is is the #1 influencer over 2 standard deviation moves in any direction in AAPL.
You don't have to know astrology to get value from Time Trades. It distills all the astrological events down to clear probabilities.