The Timing Toolkit for TradingView

Your Time Trades subscription includes 22 TradingView scripts.

Develop your timing edge with advanced analysis tools for any timeframe.

Visualize and understand the effect of astro cycles on stocks, commodities, currencies and crypto.

Combine with price action analysis for perfect entries and exits.

TT Planetary Lines TradingView script screenshot

TT Planetary Lines

Displays planet locations converted to price on your TradingView price chart.

  • Find hidden support and resistance levels.
  • Supports all planets in the system including Chiron and Lunar points like the nodes and apogee.
  • Supports heliocentric, geocentric, synodic and diurnals.
  • Customizable scaling and mirroring.
  • Displays longitude data in the Data Window

Watch the tutorial

TT Diurnals TradingView script screenshot

TT Diurnals

This script displays when planets are rising, directly overhead, and (for the sun) setting over 4 major financial centers.

This is intended for day traders and will only display on 15 minute intervals or less.

Supports 16 different diurnal locations globally including NYC, Mumbai, Brussels, Tokyo, São Paulo, Istanbul

For a complete tutorial on this script, see this YouTube video

TT Gann Fans TradingView script screenshot

TT Gann Fans

Implements Gann Fans using over 60+ planetary cycles to support any timeframe.

  • Supports up to 9 fans anchored to a specific point in price and time.
  • Supports all planets in the system including Chiron and Lunar points like the nodes and apogee.
  • Supports heliocentric, geocentric, synodic and diurnals.
  • Displays longitude data in the Data Window
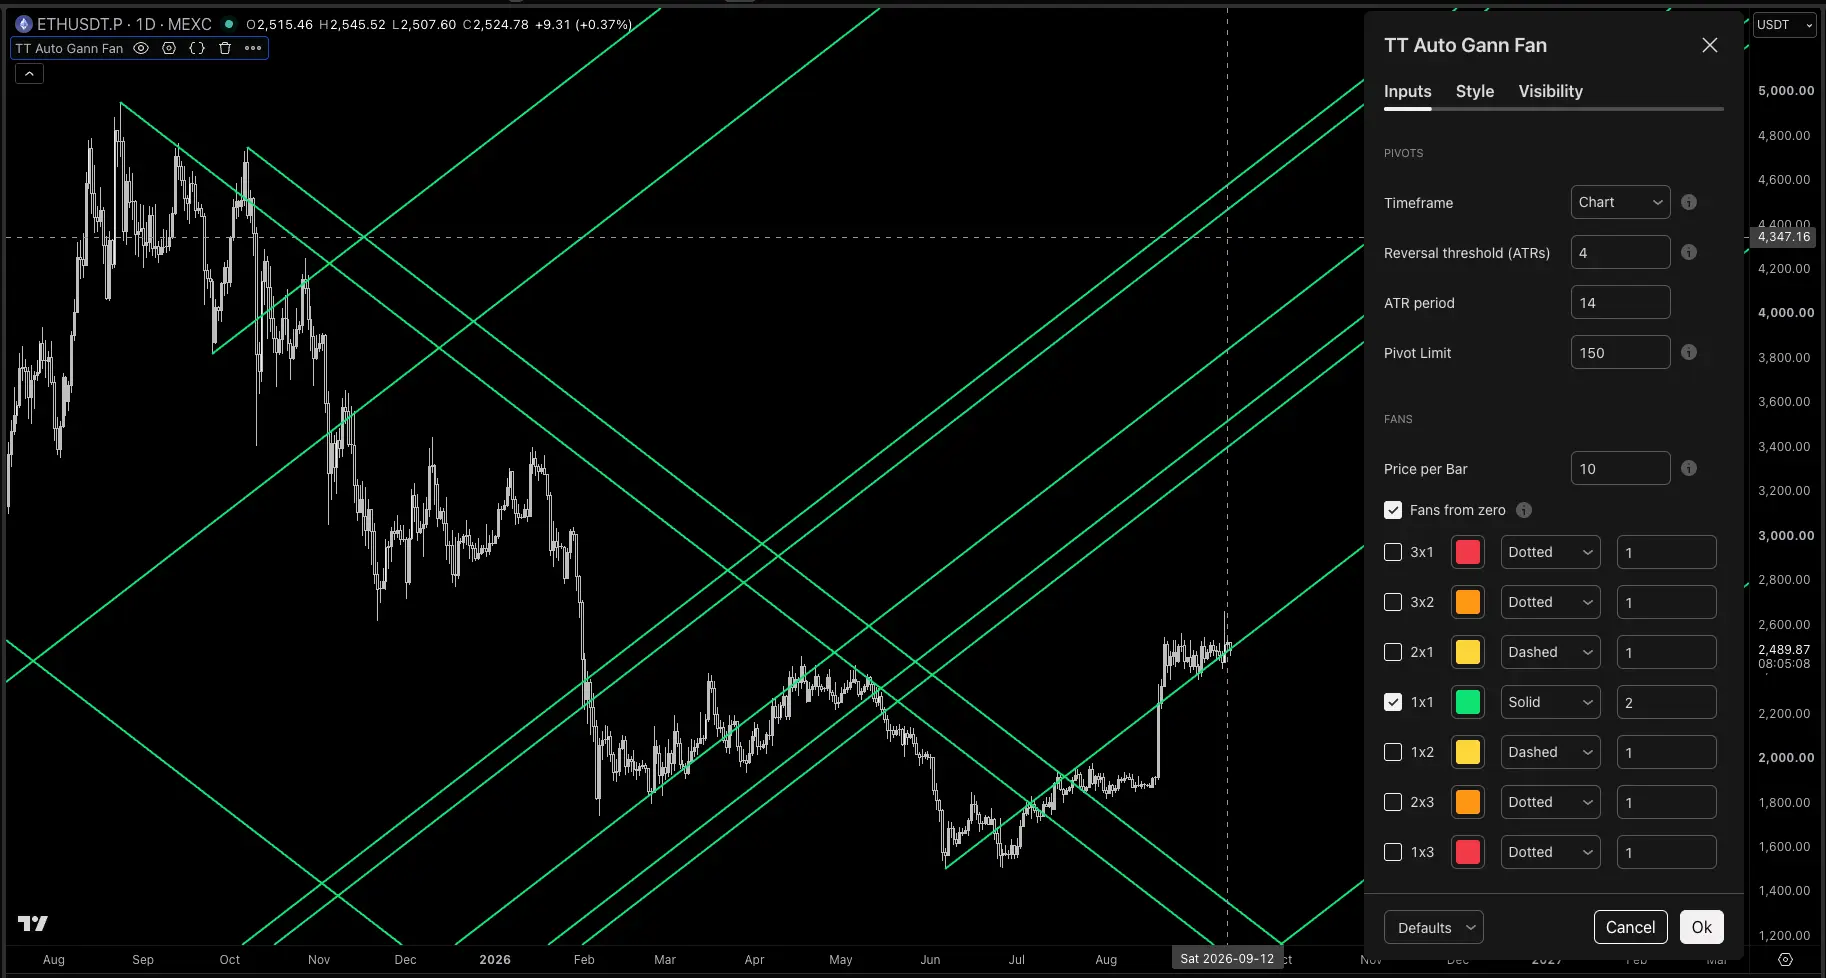
TT Auto Gann Fans TradingView script screenshot

TT Auto Gann Fans

Tired of manually anchoring Gann Fans to pivots?

I was too so I created this script that automatically finds the pivots and anchors a Gann Fan to them

See all relevant Gann Fans in seconds and rapidly experiment with different scaling factors.

Take your application of Gann techniques to the next level.

TT Square of 9 TradingView script screenshot

TT Square of 9

Finally make using Gann's Square of 9 simple.

Drop this script on an important time and price and it draws the time and price lines into the future based on cycles around the Square of 9.

Easily apply square of 9 concepts to your chart.

  • Displays both time and price levels based on the Square of 9.
  • Supports heliocentric, geocentric, synodic and diurnal time factors.
  • Customizable scaling.
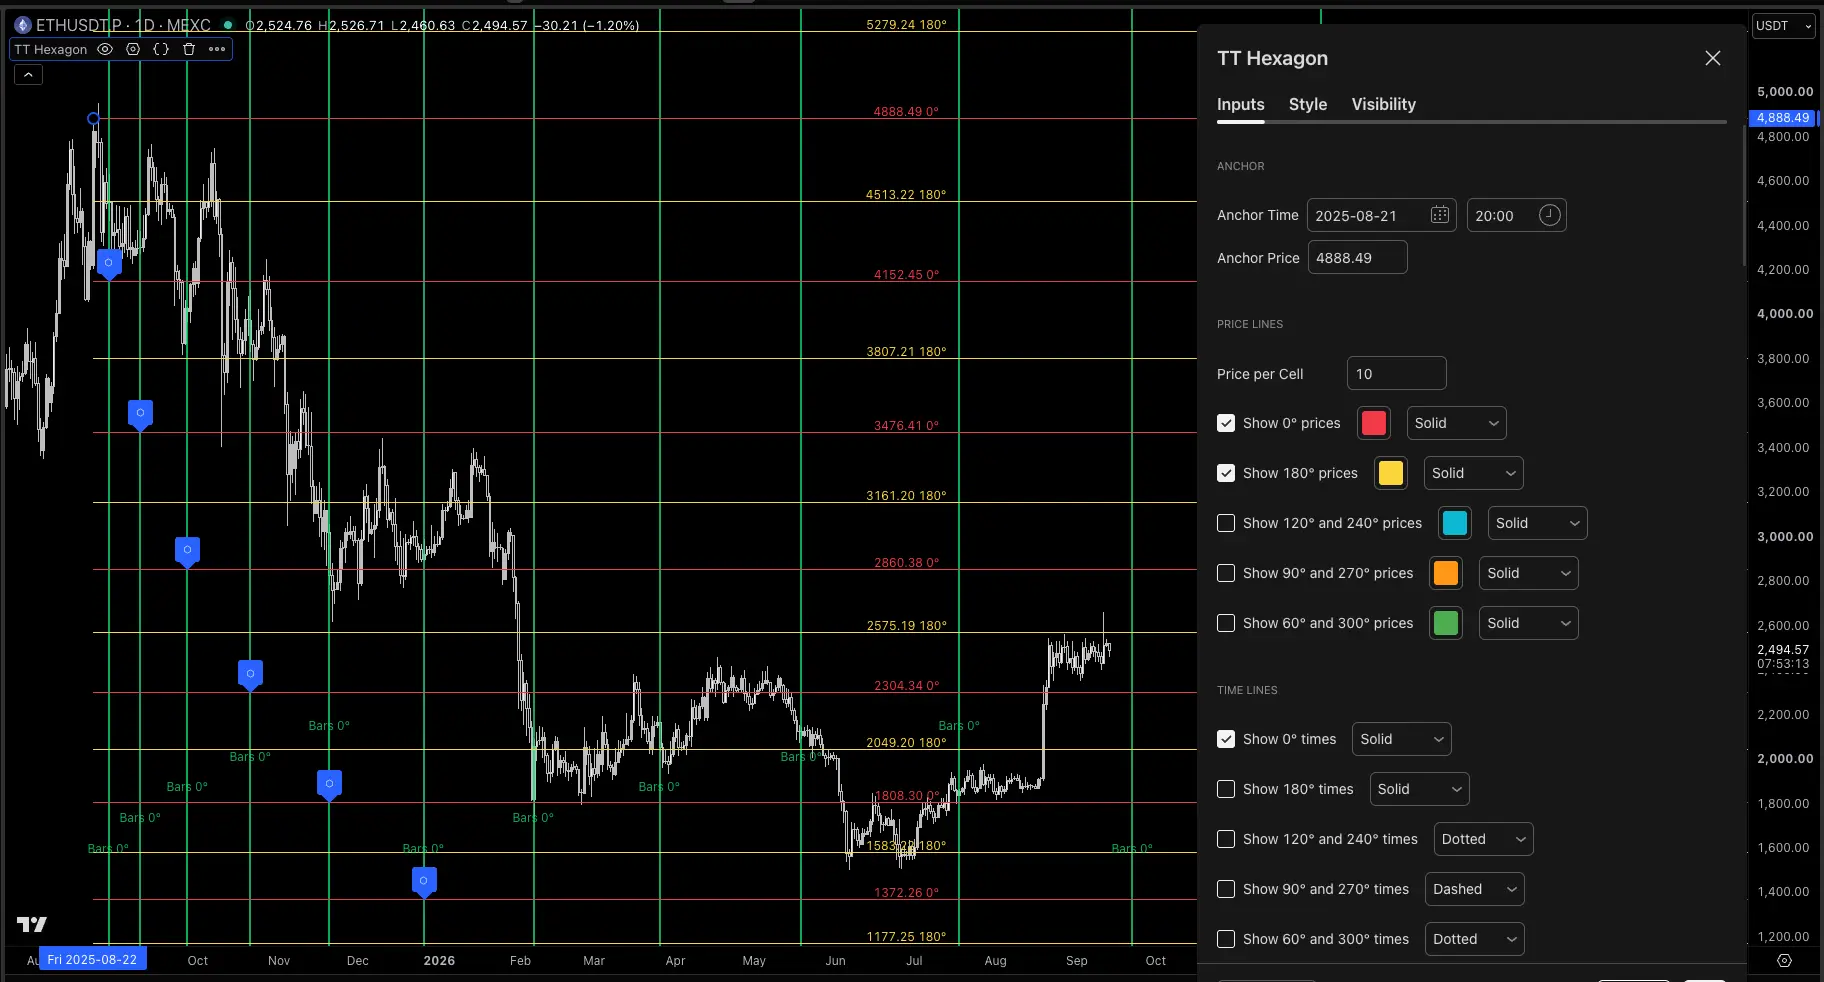
TT Hexagon TradingView script screenshot

TT Hexagon

Gann used more than just the Square of 9

The Hexagon is very effective on crypto and precious metals

Drop this script on an important time and price and it draws the time and price lines into the future based on cycles around the Hexagon.

  • Displays both time and price levels based on the Hexagon.
  • Supports heliocentric, geocentric, synodic and diurnal time factors.
  • Customizable scaling.
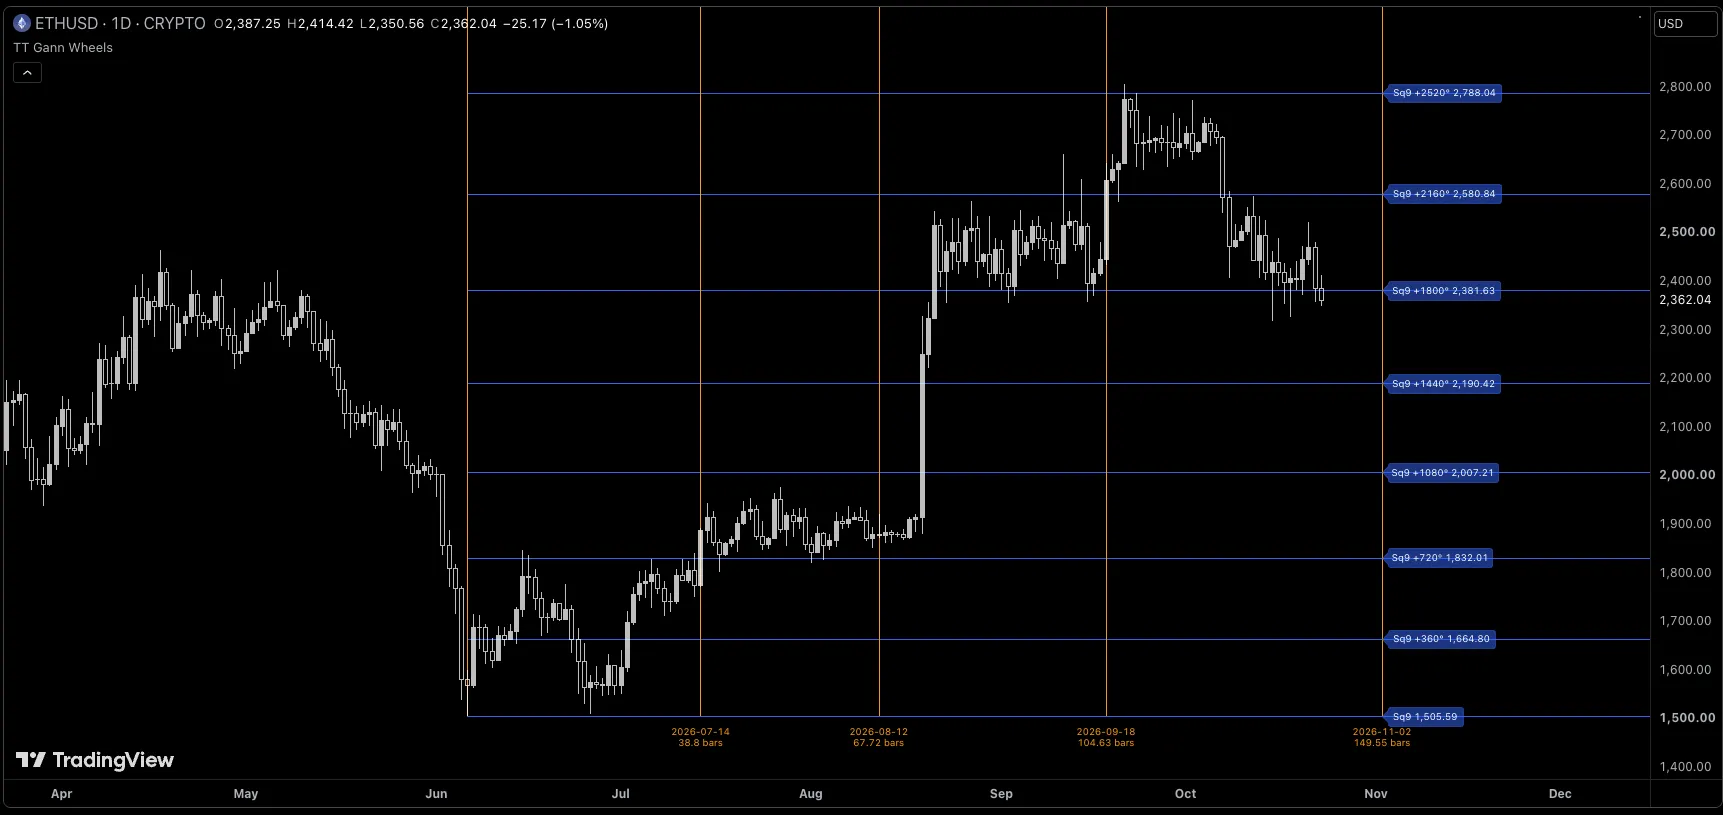
TT Gann Wheels TradingView script screenshot

TT Gann Wheels

Draws a price and time grid projected from a single anchor point, normally a major high or low.

  • Price lines follow the anchor price around Gann's Square of Nine or Hexagon wheel, one full 360° cycle per row.
  • Time lines start at the square root of the anchor price and expand outward in the same 360° steps.
  • Choose the wheel for price and the wheel for time separately.
  • Count time in bars, calendar time or the travel of a planet.
  • Analysis table compares how price has behaved at the Square of Nine and Hexagon lines from your anchor.
TT Ruler TradingView script screenshot

TT Ruler

Displays labels at intervals of heliocentric or synodic travel. Ideal for Gann-style timing research.

  • Choose any planet or synodic pair as the basis for the intervals.
  • Intervals can be based on either heliocentric or synodic travel.
  • Display the labels forwards into the future or backwards into the past.
  • Displays longitude data in the Data Window.

Watch the tutorial
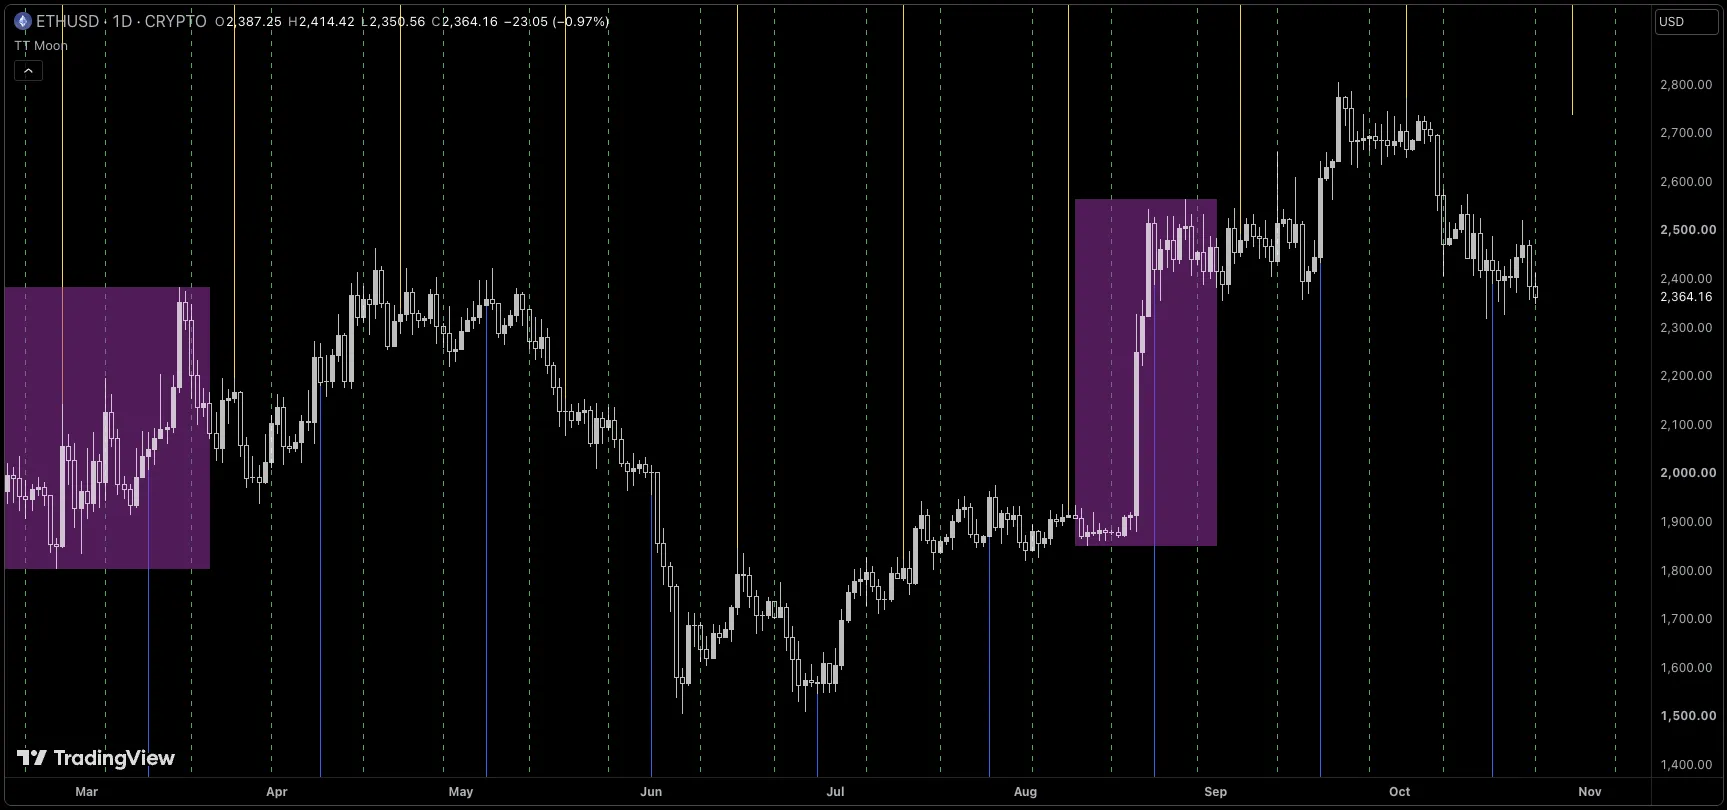
TT Moon TradingView script screenshot

TT Moon

Marks the Moon's timing events on your chart. Each feature can be switched on or off on its own.

Events are calculated live for any date from 1750 to 2150, so the script never needs updating.

  • Solar and lunar eclipses
  • Eclipse seasons
  • True Node Speed Max lines
  • Lunar apogee and perigee
  • Lunar declination
  • The Moon's sign changes
  • Moon void of course
  • Lunar aspects
  • Vedic intraday periods
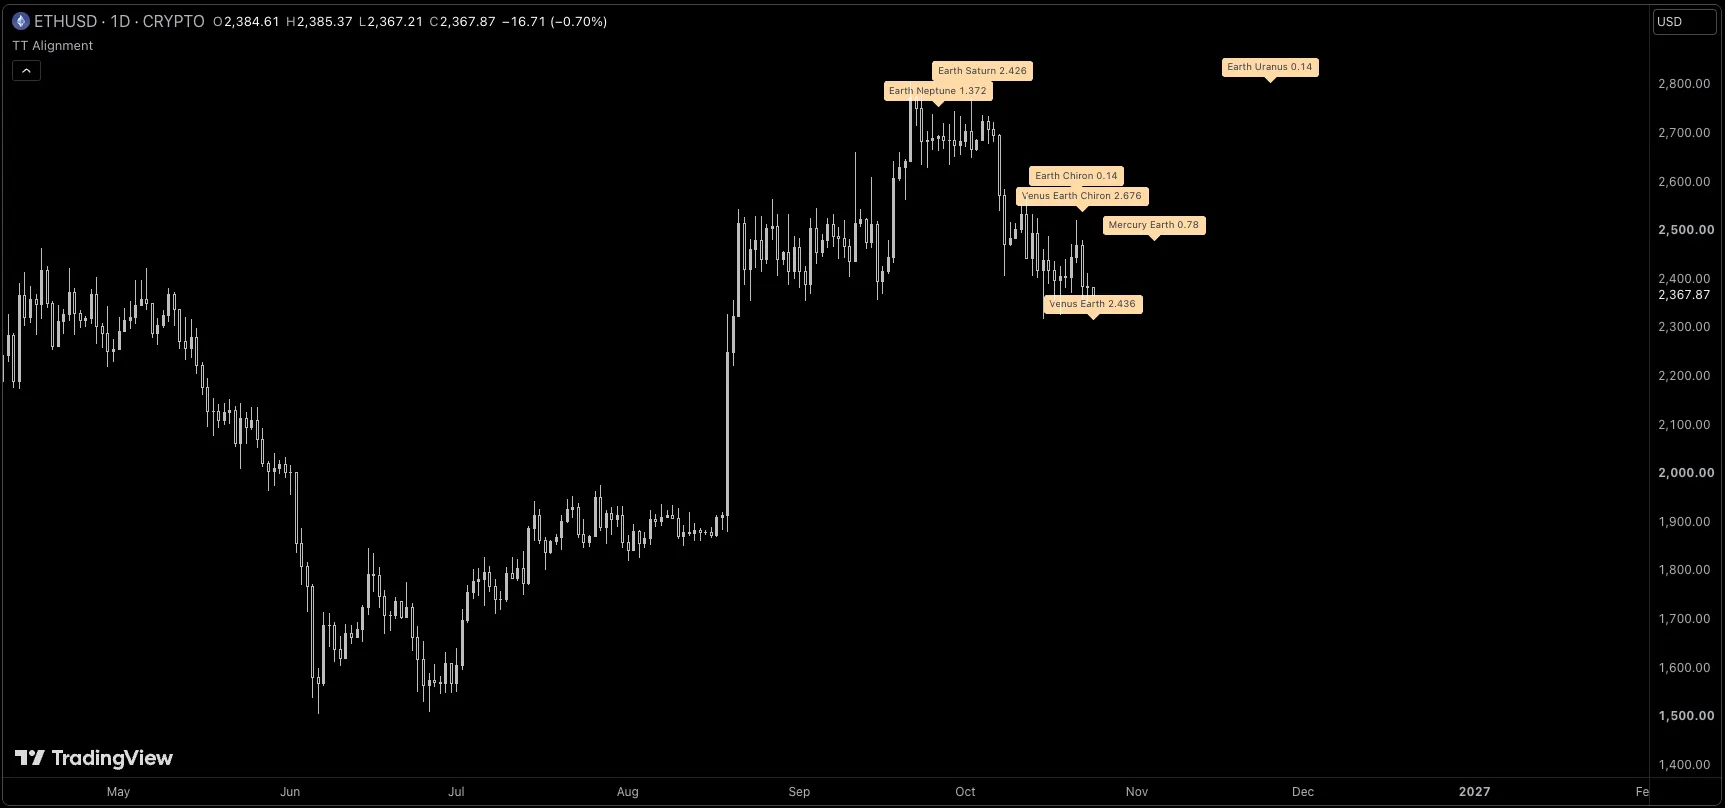
TT Alignment TradingView script screenshot

TT Alignment

Marks planetary alignments on your price chart: the moments when two or three bodies of the solar system line up most closely in three dimensions, as seen from the Sun.

  • Labels each lineup at its tightest, when the bodies are within 3 degrees of each other.
  • Includes the planets, Chiron and the asteroids Ceres, Pallas, Juno and Vesta.
  • Labels the next ten peaks to the right of the latest bar so you can plan ahead.
  • Calculated live for any date from 1750 to 2150.
TT Vibration TradingView script screenshot

TT Vibration

Learn the Law of Vibration by exploring it hands-on within TradingView.

Find the harmonics that resonate with a given asset.

Supports heliocentric and synodic cycles of all planets plus Chiron.

Supports Ascendant, Midheaven, Part of Fortune and lunar cycles for intraday use.

Supports any arbitrary user-defined harmonic.

Combine multiple harmonics together to create a compound wave.

Watch the tutorial

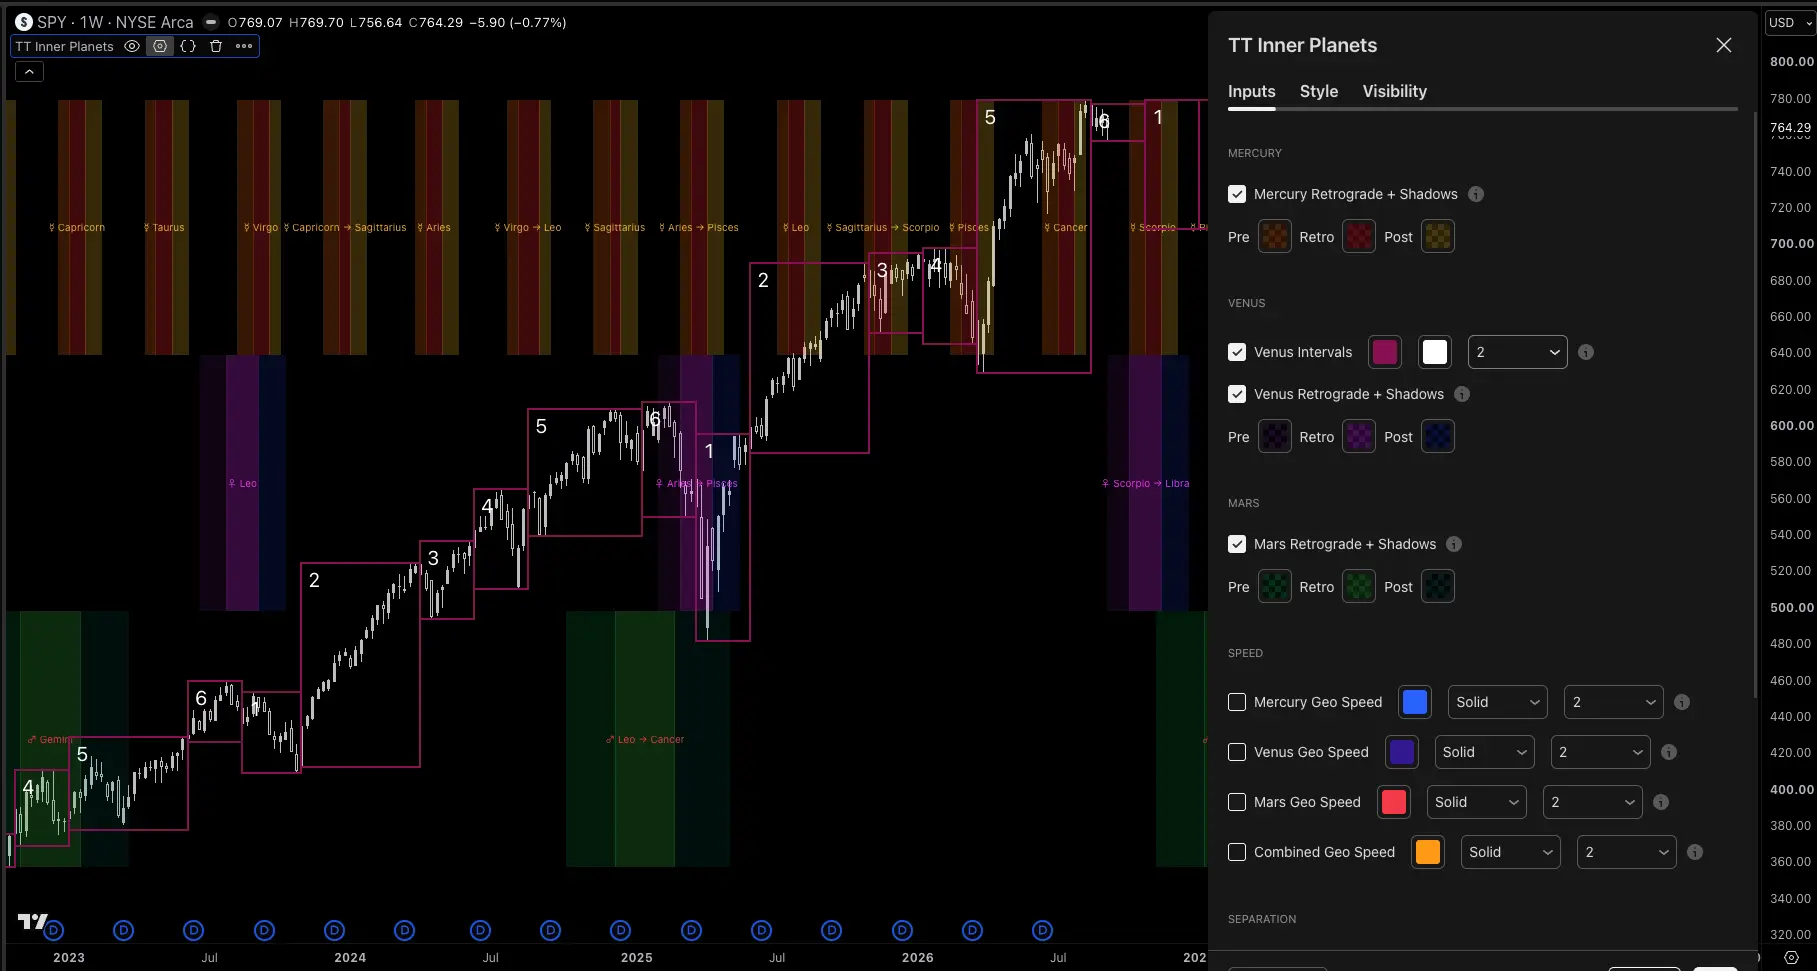
TT Inner Planets TradingView script screenshot

TT Inner Planets

Displays major cycles of inner planets Mercury, Venus and Mars.

  • Retrogrades, including pre and post-shadow periods
  • Venus intervals.
  • Speed of the inner planets relative to Earth.
  • Separation of the inner planets.
  • Zodiac sign during retrograde.
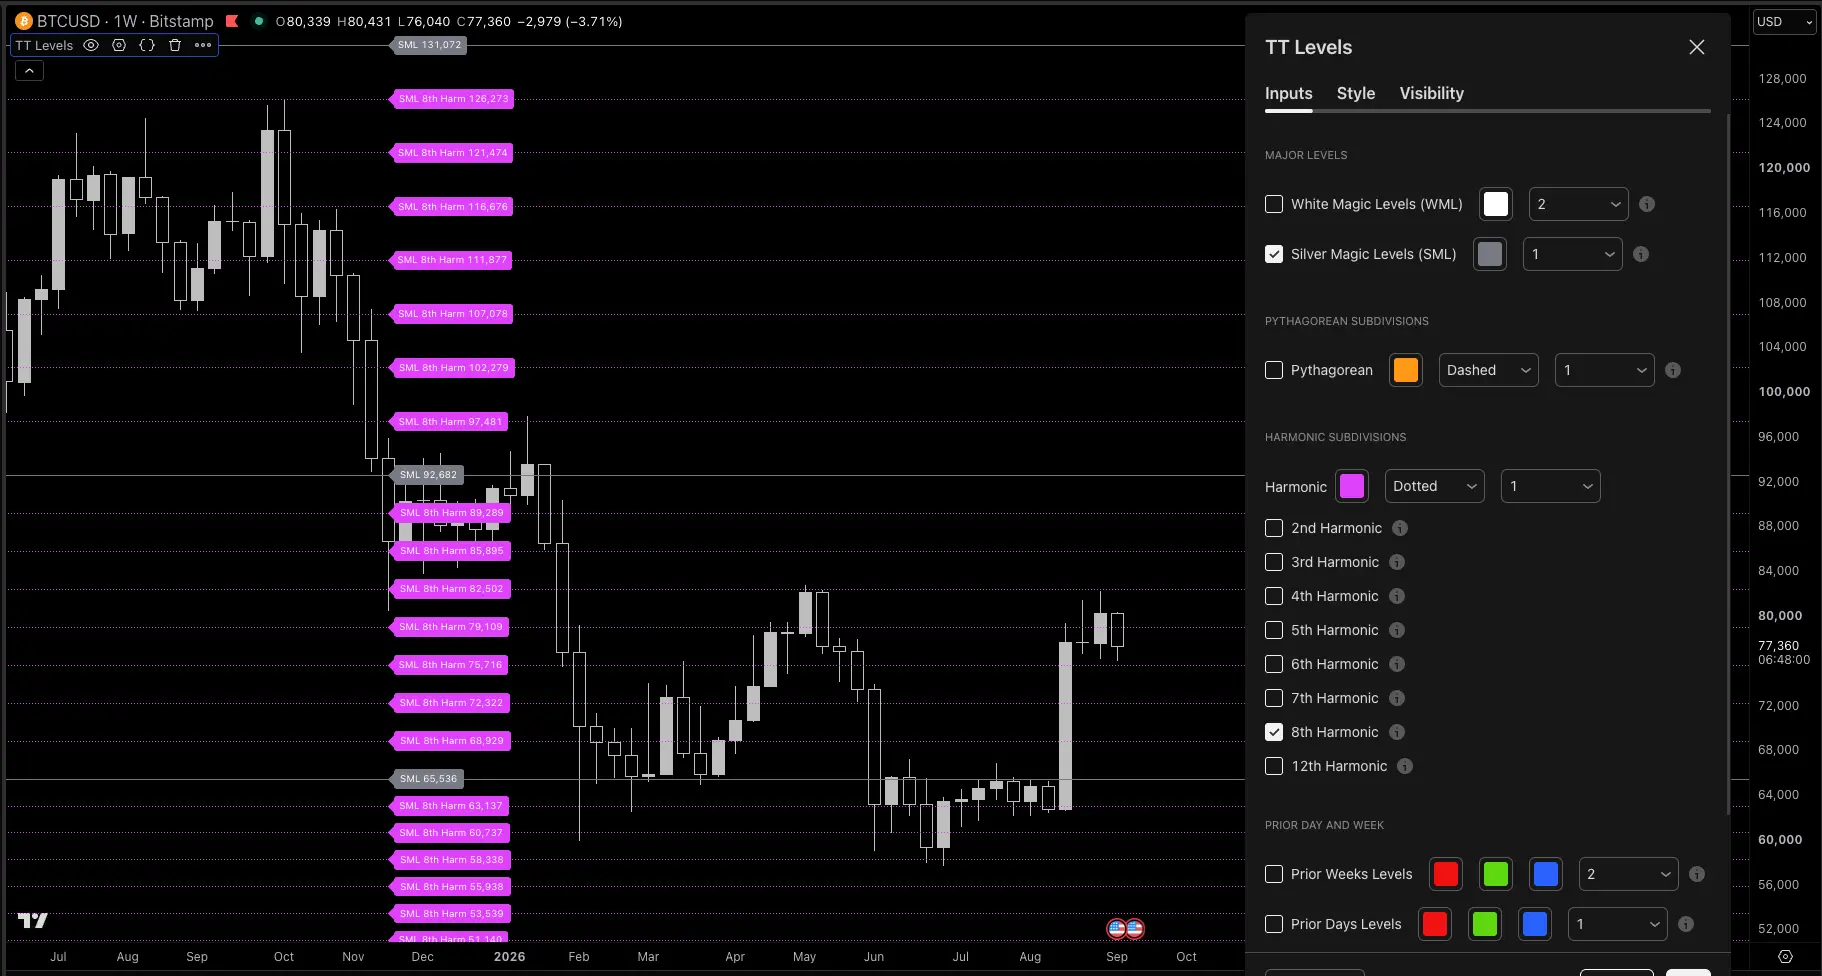
TT Levels TradingView script screenshot

TT Levels

Display levels based on Golden ratio and Silver ratio.

Subdivide these levels into any harmonic including pythagorean subdivisions.

Find key hidden levels of support and resistance

TT Harmonics TradingView script screenshot

TT Harmonics

Displays harmonic ratios of a price and time range using either a 12 or 24 note scale.

  • Identify a base range.
  • Expand the base range by mathematical factors like phi, Euler's number, Feigenbaum constant and more.
  • Create new ranges of 2x, 4x, and 16x the base range.

Watch the tutorial

TT Count TradingView script screenshot

TT Count

A powerful automatic cycle counter that will identify pivots and count time cycles between those pivots.

It will also count cycles into the near future and identify future days with a large numbers of cycle completions from previously labelled pivots.

  • Full control over how sensitive the pivot detection is.
  • Cycle counts are applied to the hourly, daily, weekly and monthly timeframes.
  • Fibonacci cycles.
  • Lucas number cycles.
  • Biblical cycles.
  • Sacred geometry cycles.

Watch the tutorial

TT Measure TradingView script screenshot

TT Measure

Measures the time between 2 points in degrees of planetary travel.

Identify potential cycles for further research.

Measures time using the following planets and points:

  • Ascendant
  • Sidereal Moon (27.3 days) and Synodic Moon (29.5 days)
  • True Node, Mean Node and Lunar Apogee
  • Helio Mercury, Venus, Earth, Mars
  • Helio Mars, Jupiter, Saturn, Chiron, Uranus, Neptune, Pluto
  • Synodic pairs of all combinations of planets including Chiron.
TT Pentagrams TradingView script screenshot

TT Pentagrams

Based on Brad Cowan's book 'Pentagonal Time Cycle Theory', this indicator identifies when planet pairs are separated by 72° or 144° while being located on a user-defined pentagram.

TT Energy Lunar TradingView script screenshot

TT Energy Lunar

Displays reflected lunar energy including the effect of Moon/Earth distance

  • Precise timing of moon phases.
  • Cycles of lunar intensity based on lunar phase plus distance from Earth.

Watch the tutorial

TT Energy Jupiter TradingView script screenshot

TT Energy Jupiter

Displays Earth's proximity to Jupiter and Jupiter's proximity to major fixed stars.

  • Visualize the energetic effect of Jupiter relative to Earth.
  • Cycles of Jupiter's influence based on its position relative to Earth and major fixed stars.
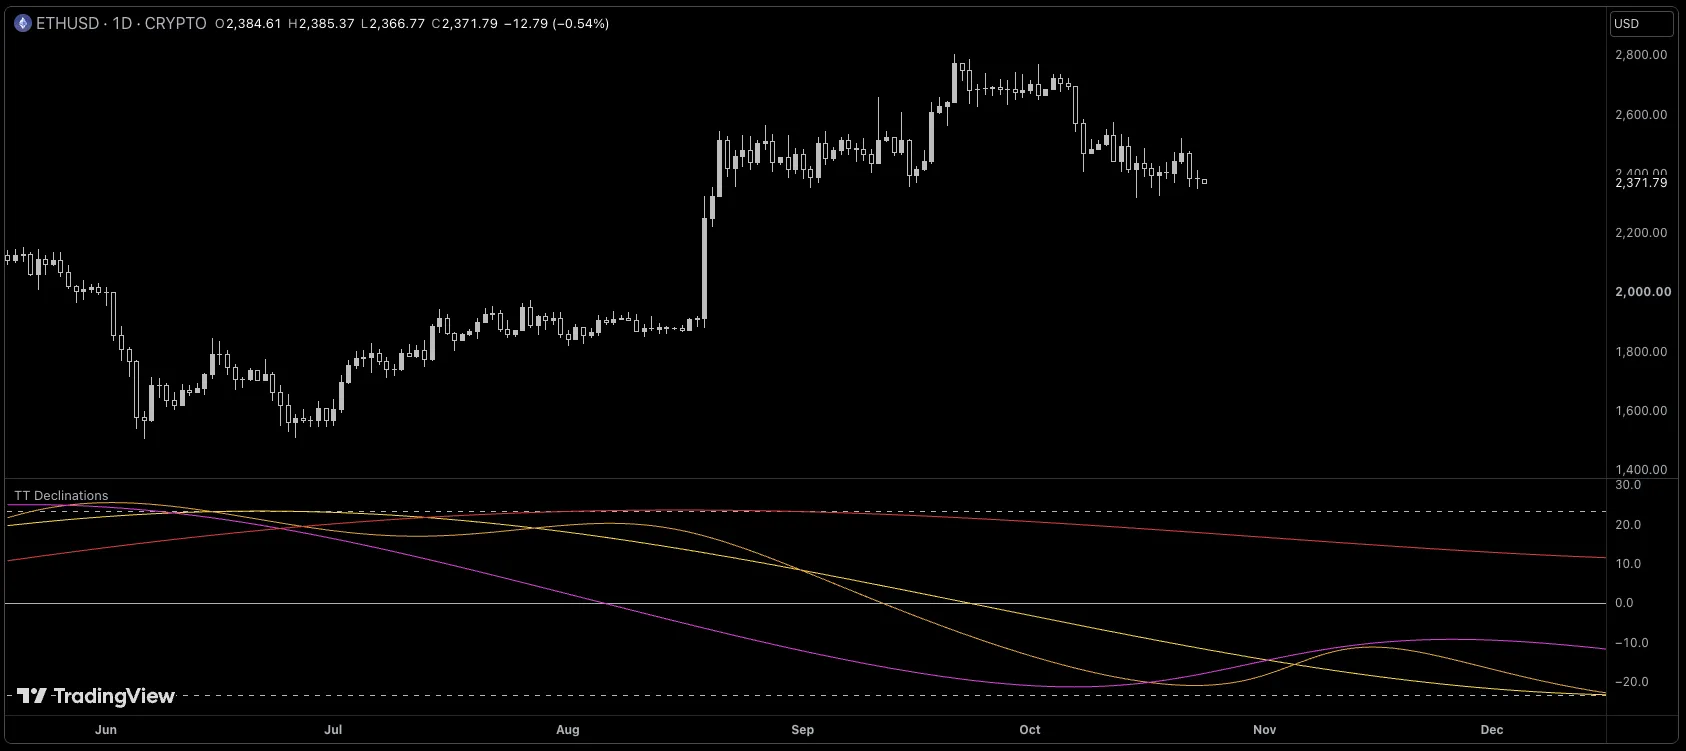
TT Declinations TradingView script screenshot

TT Declinations

Draws the declination of the Sun, the Moon, Mercury, Venus and Mars in a pane below your price chart.

  • Calculated live for any date from 1750 to 2150, and continues past the latest bar into the future.
  • Reference lines at the celestial equator and at the Sun's furthest north and south.
  • Declination crosses and extremes tend to correlate with changes in trend.
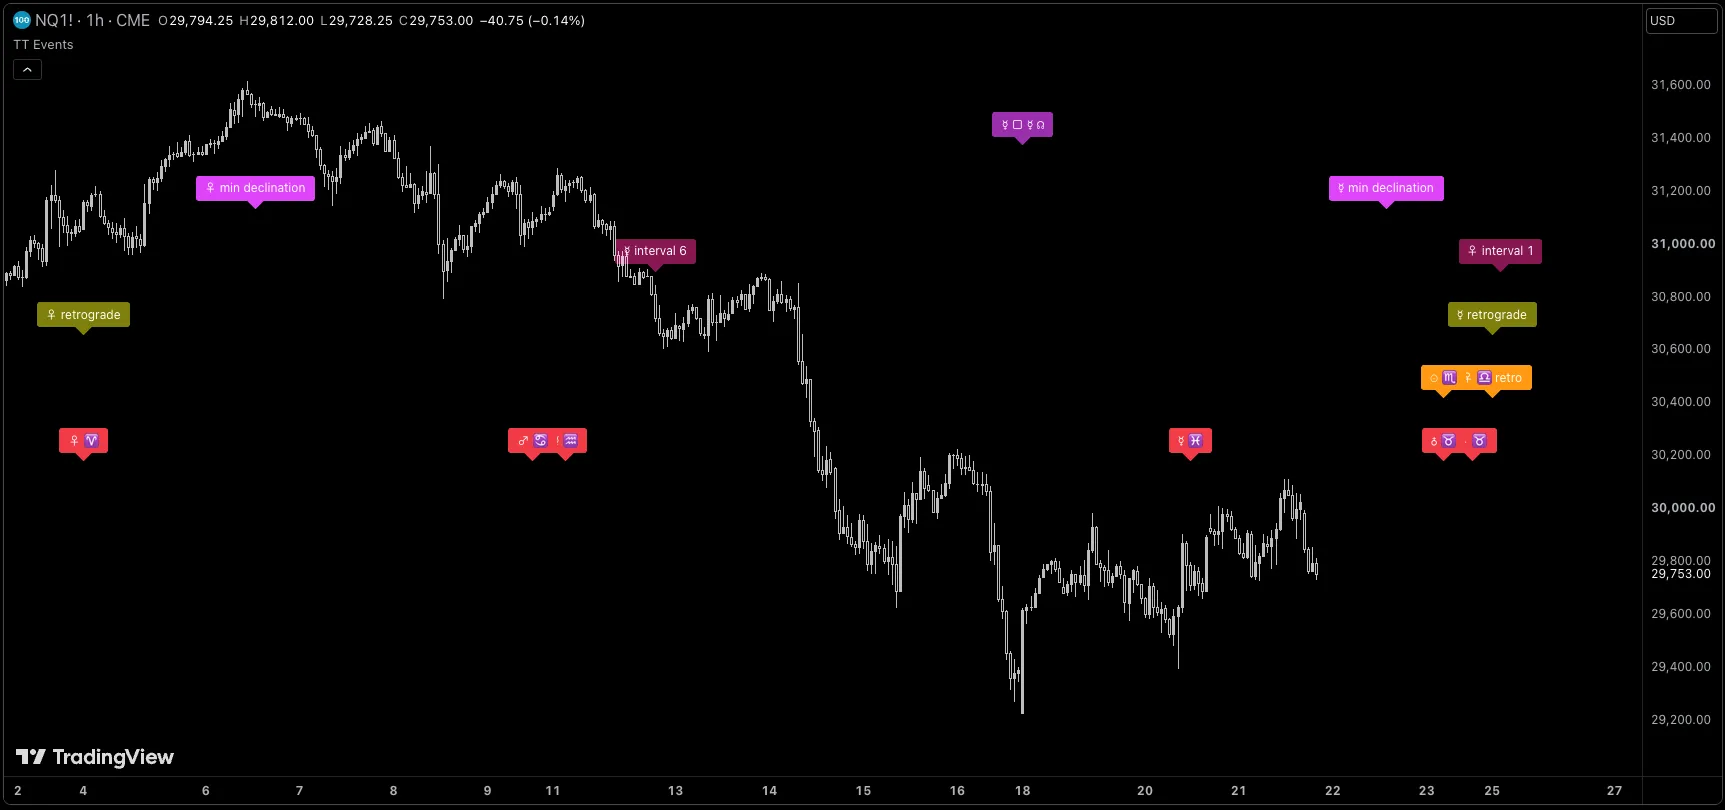
TT Events TradingView script screenshot

TT Events

Labels the planetary events that matter to Time Trades on your price chart, calculated live for any date from 1750 to 2150.

  • Aspects between the planets, seen from the Earth and from the Sun.
  • Planets crossing their own nodes.
  • Declination highs, lows and zero crossings.
  • Closest and farthest points, like perigee, apogee, perihelion and aphelion.
  • Retrograde and direct stations.
  • Sign changes in the tropical, sidereal and heliocentric zodiacs.
  • The six orbital intervals of each planet.
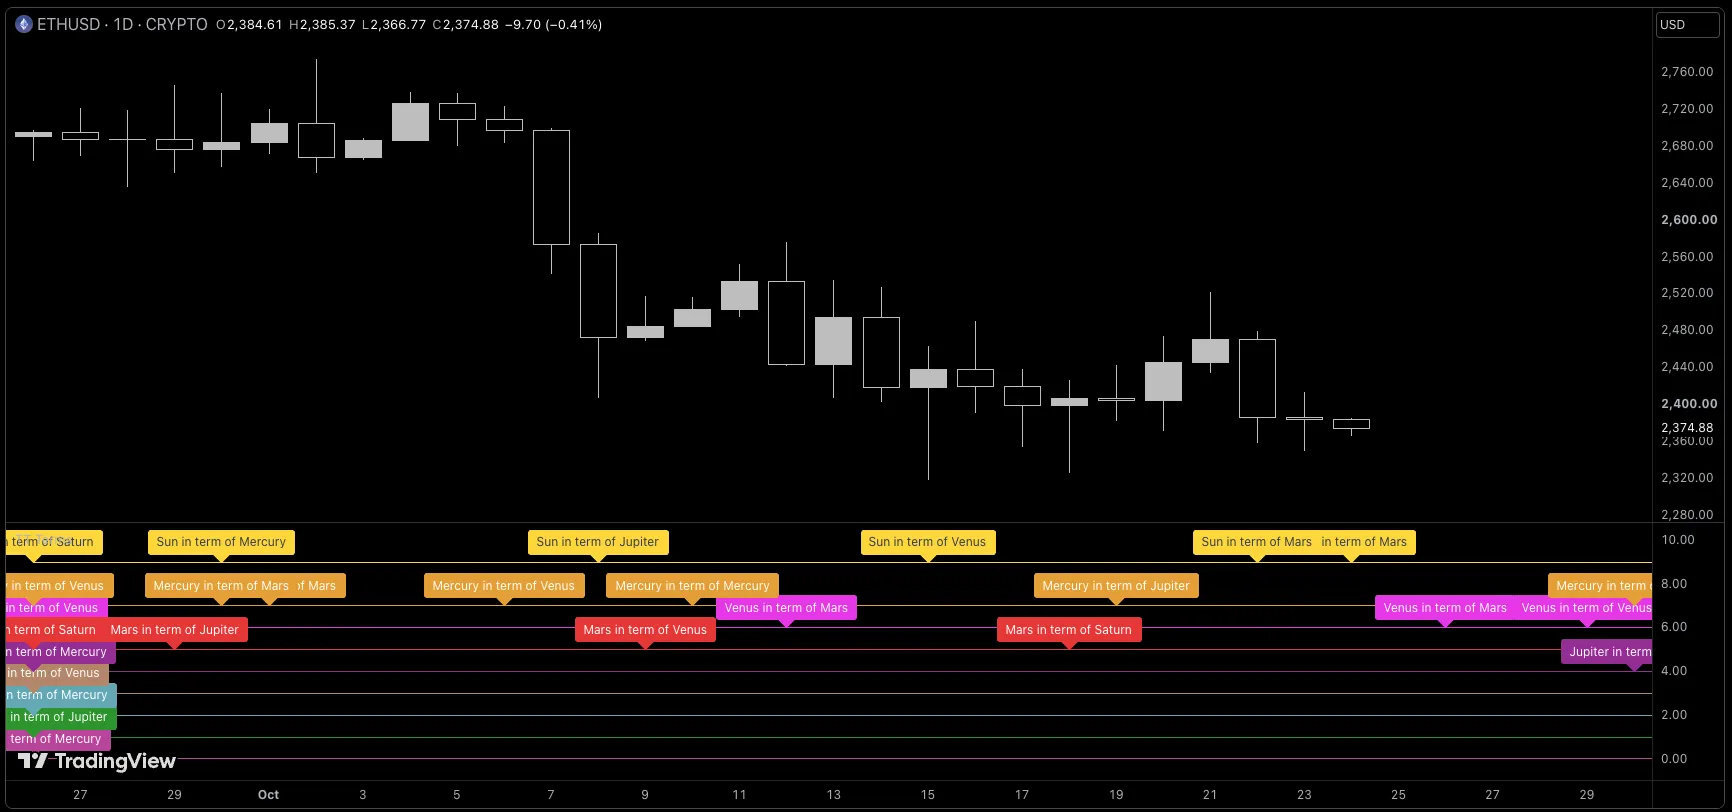
TT Terms TradingView script screenshot

TT Terms

Shows which Egyptian term each body is passing through, in a pane below your price chart.

The terms, also called bounds, divide each sign of the zodiac into five unequal parts, each ruled by Mercury, Venus, Mars, Jupiter or Saturn.

The Sun, the Moon and the planets from Mercury to Pluto each have their own row, with a label when a body enters a new term.

Calculated live for any date from 1750 to 2150, and continues past the latest bar into the future.